
Monitors
24/7 uptime monitoring from multiple regionsEdit
Monitors continuously check your services and alert you when issues occur. Run checks from multiple geographic regions to detect localized outages and ensure global availability.
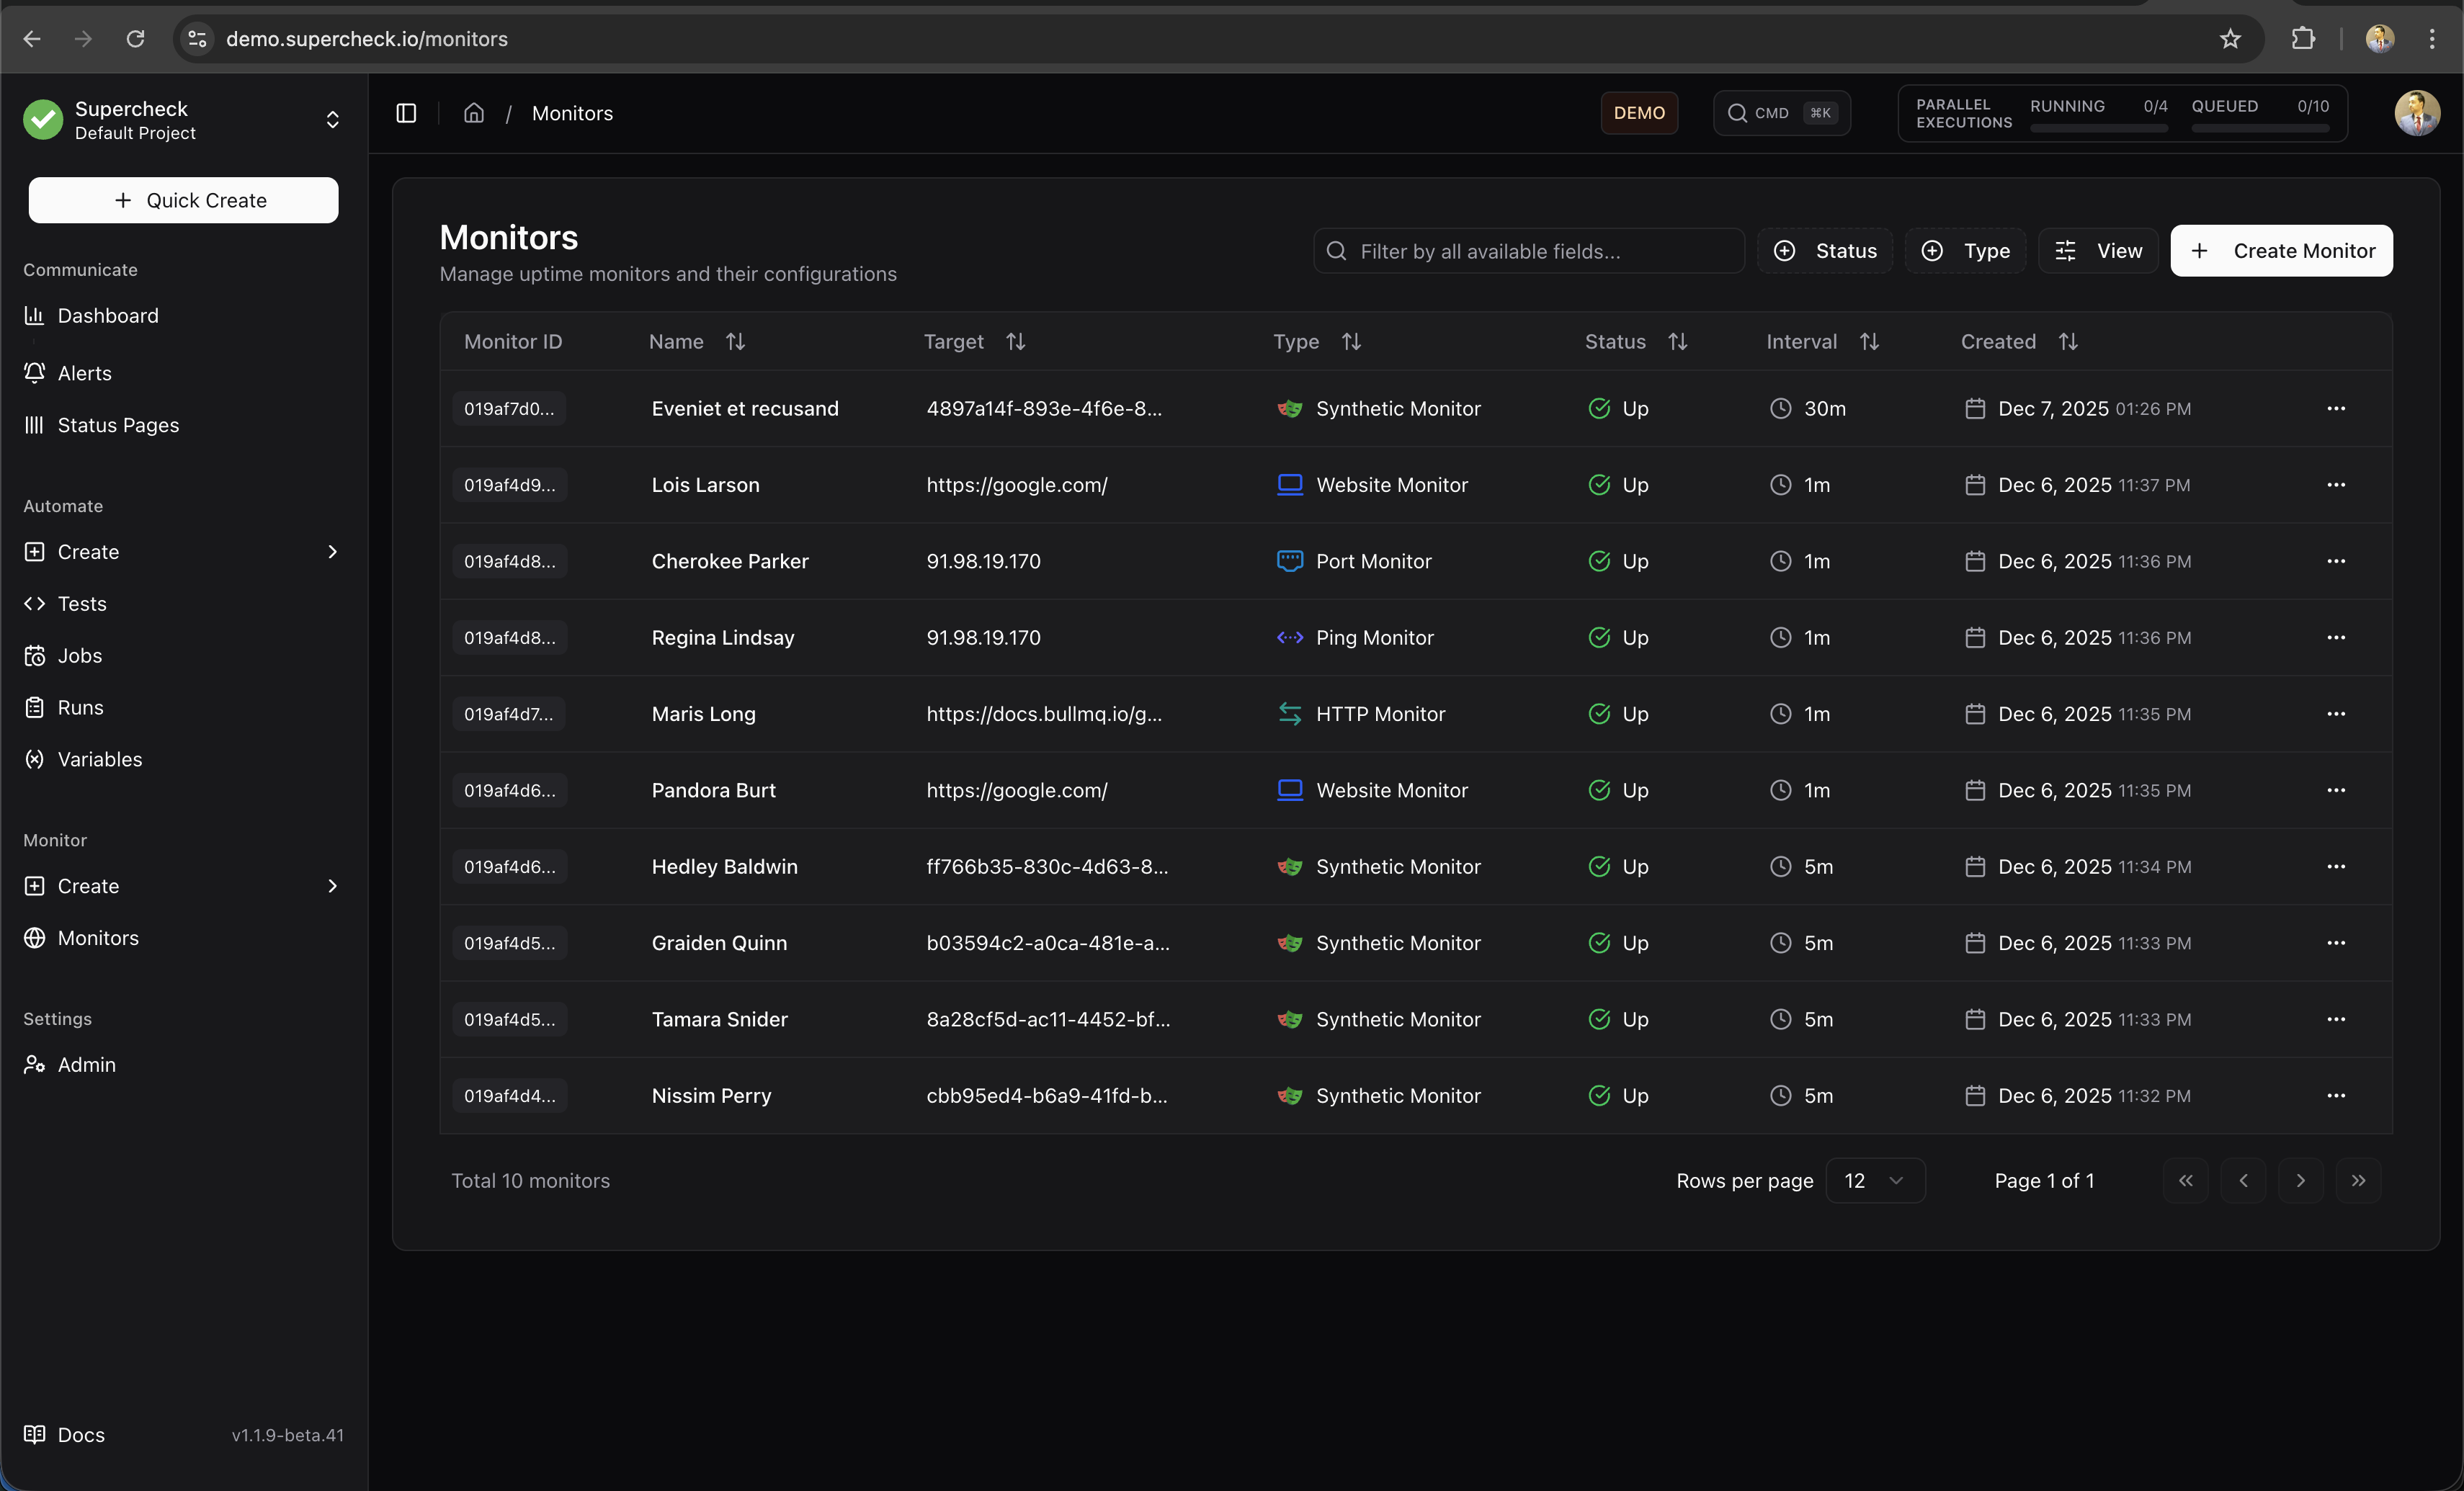
Setup Workflow
Scroll horizontally on smaller screens to view all steps.
Monitor Types
Supercheck offers five monitor types, each designed for specific use cases:
HTTP Monitor
Full-featured API and endpoint monitoring with custom headers, authentication, and response validation
Website Monitor
Simple website availability checks with SSL certificate expiration tracking
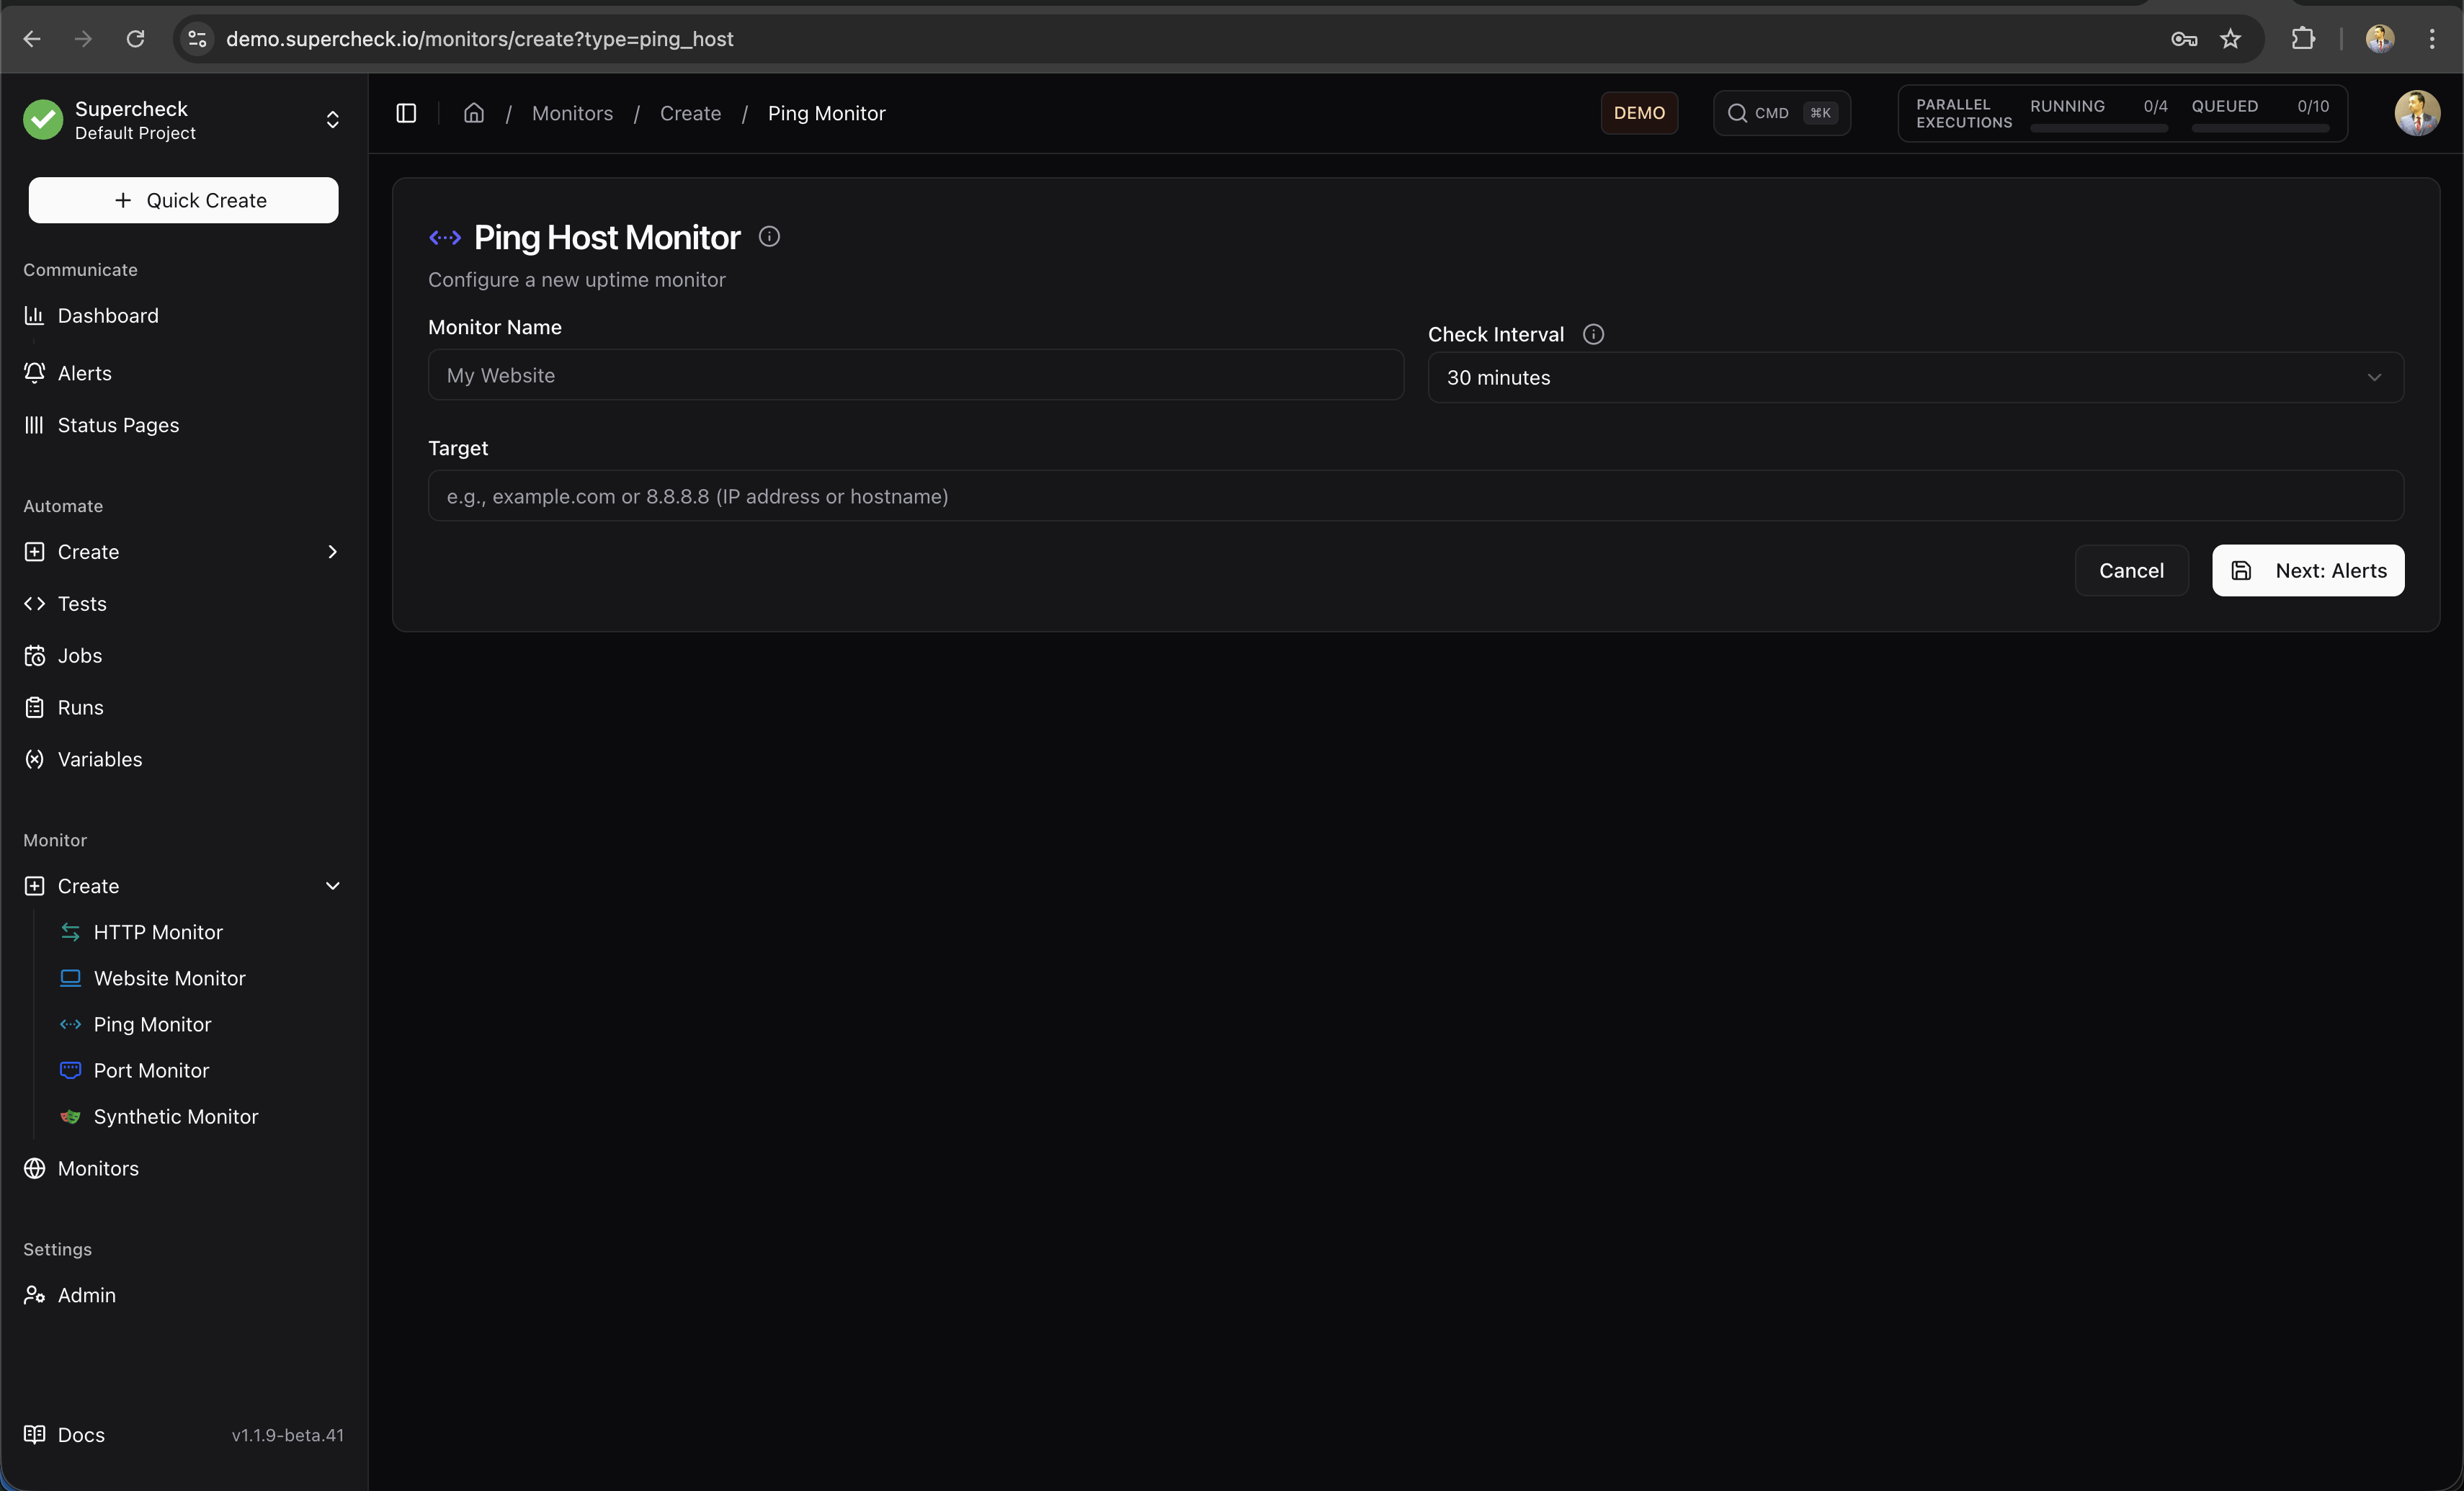
Ping Monitor
TCP reachability checks on ports 443/80 for server availability
Port Monitor
TCP/UDP port checks to verify that specific services are accepting connections
Synthetic Monitor
Run full Playwright browser tests on a schedule to validate complete user journeys
HTTP Monitor
The most versatile monitor type for APIs and web services.
What it checks:
- HTTP/HTTPS endpoint availability
- Response status codes (2xx, 3xx, 4xx, 5xx)
- Response time and latency
- Response body content (keyword validation)
- HTTPS connectivity
Configuration options:
- HTTP Method — GET, POST, PUT, DELETE, PATCH, HEAD, OPTIONS
- Custom Headers — Add authentication tokens, API keys, or custom headers
- Request Body — Send JSON or form data for POST/PUT requests
- Authentication — Basic Auth or Bearer Token support
- Expected Status — Validate specific status codes or ranges
- Keyword Validation — Check for presence or absence of text in response
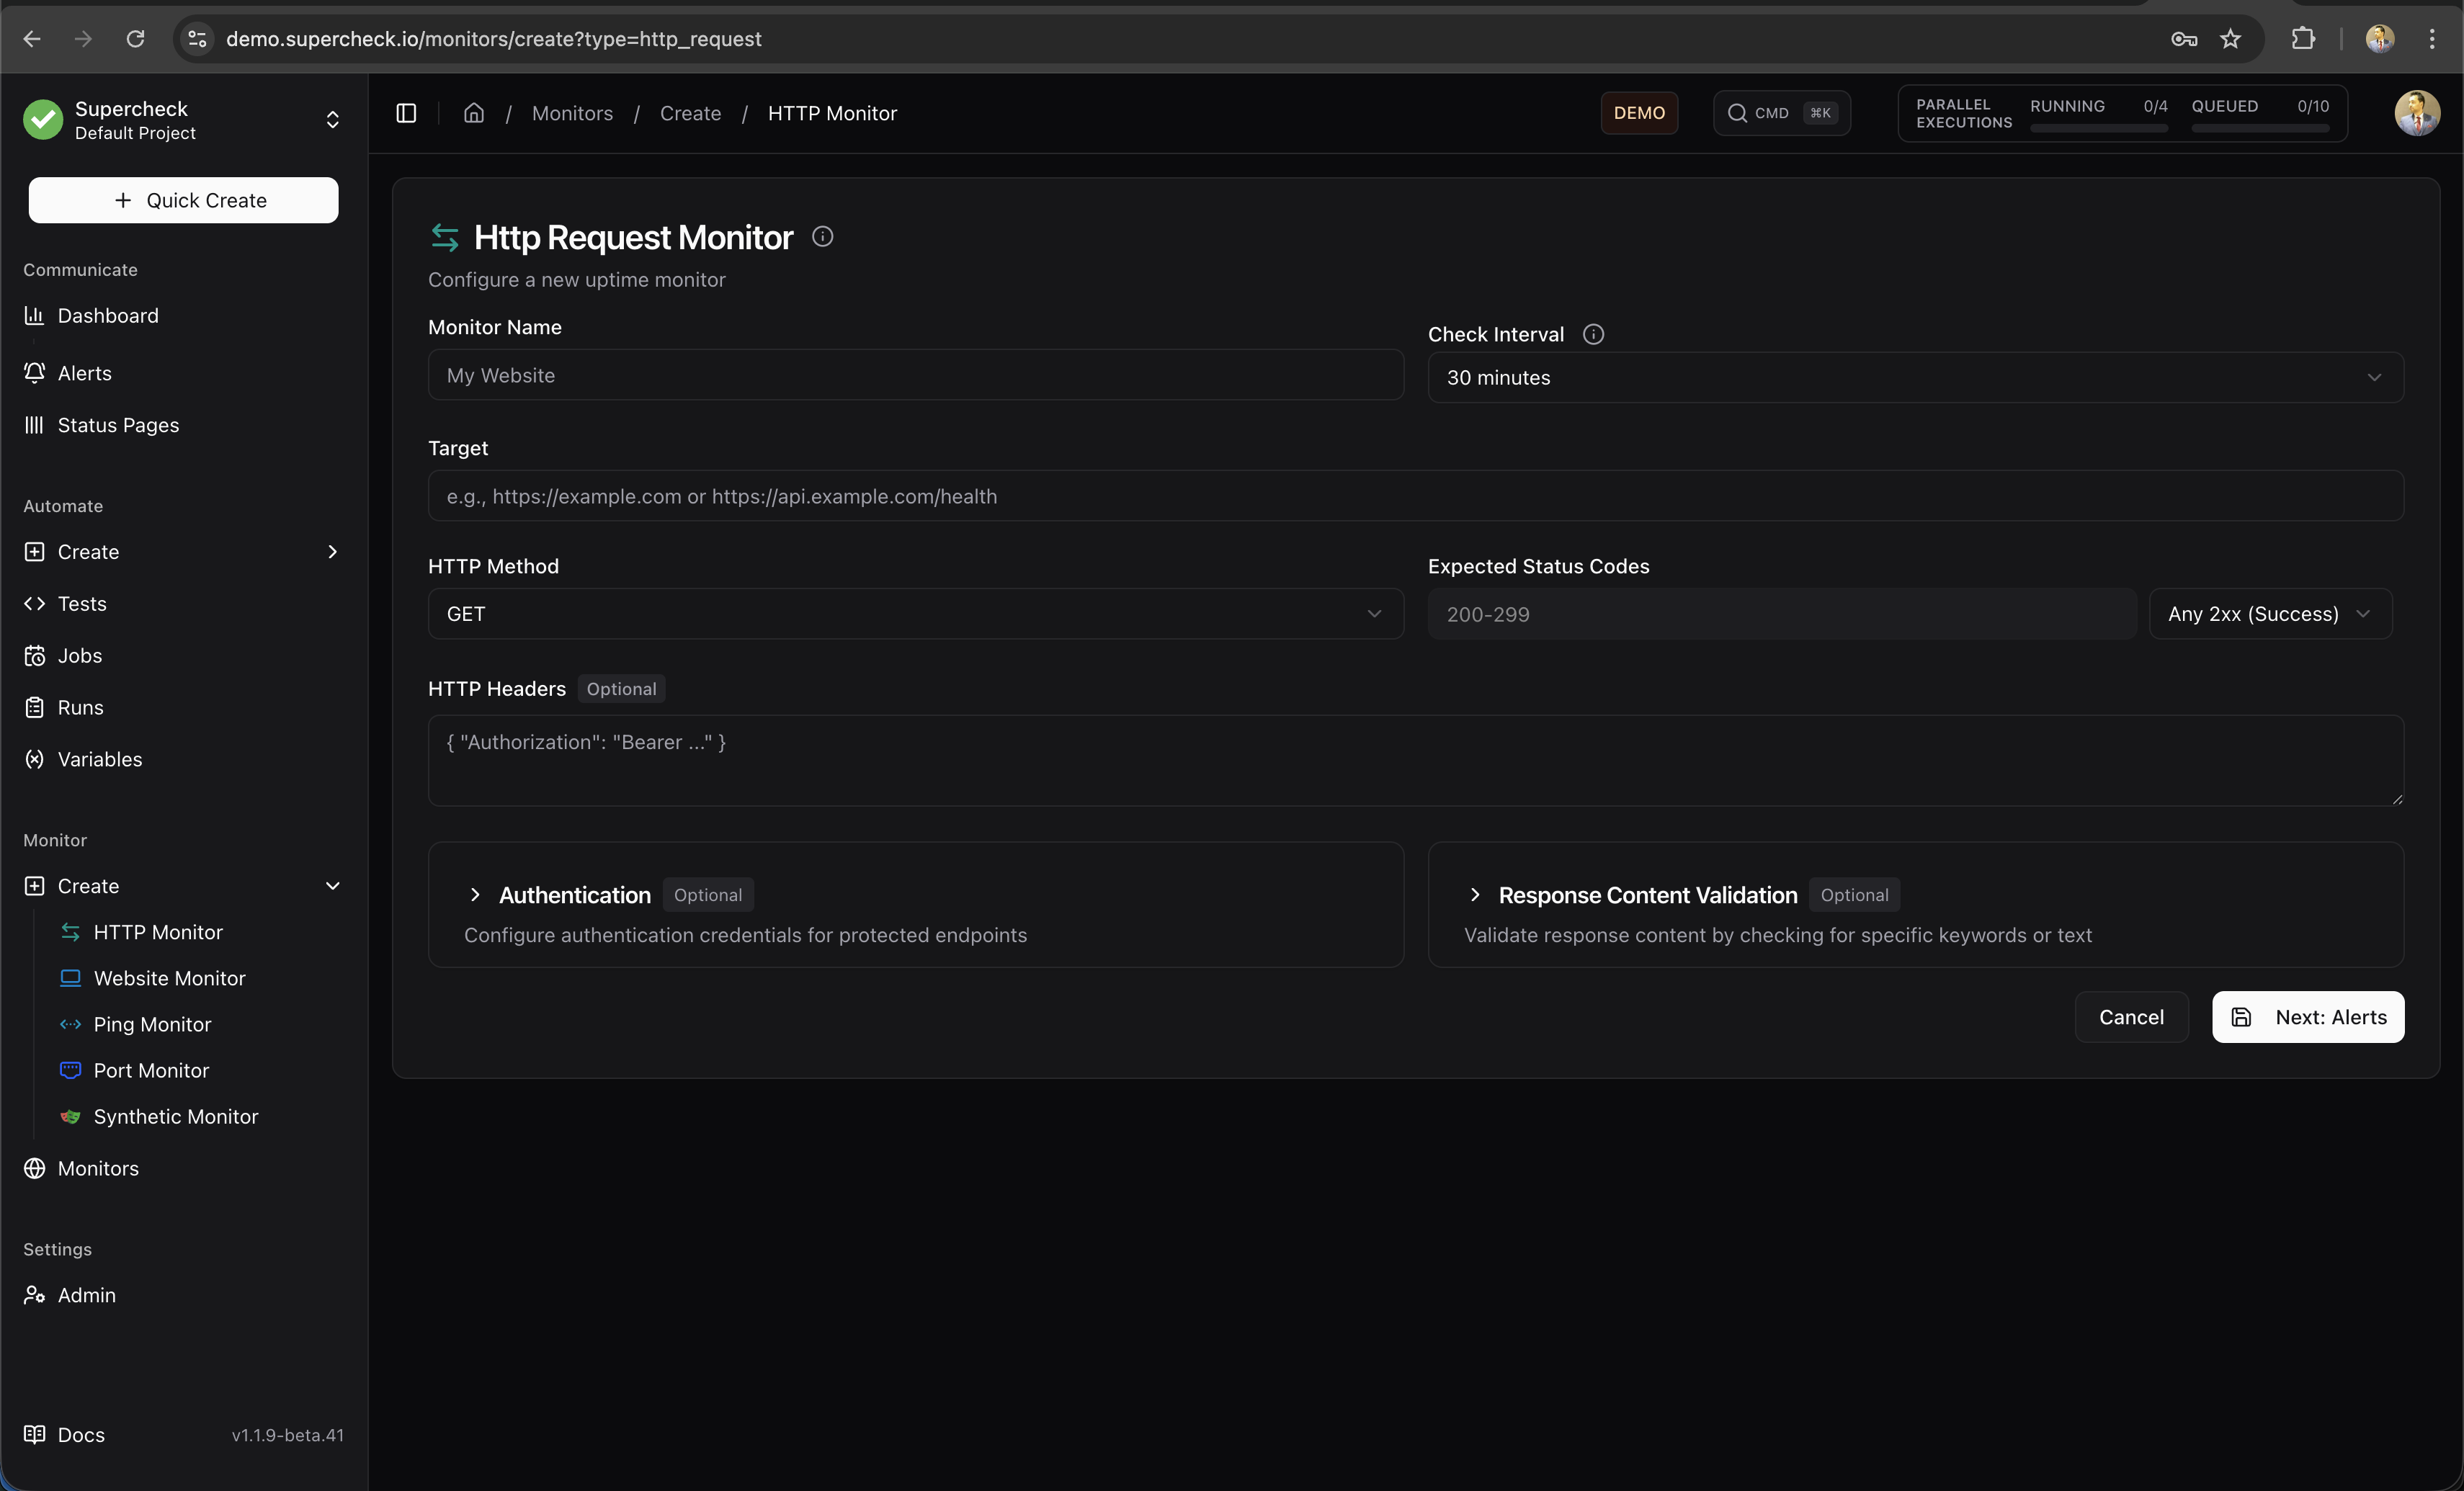
Use HTTP monitors for APIs, health check endpoints, and any service that responds to HTTP requests.
Website Monitor
Simplified monitoring for web pages with built-in SSL tracking.
What it checks:
- Page returns an expected status code (2xx by default)
- SSL certificate is valid
- SSL certificate expiration date
- Optional keyword presence on page
Best for:
- Marketing websites
- Landing pages
- Public-facing web applications
- SSL certificate expiration alerts
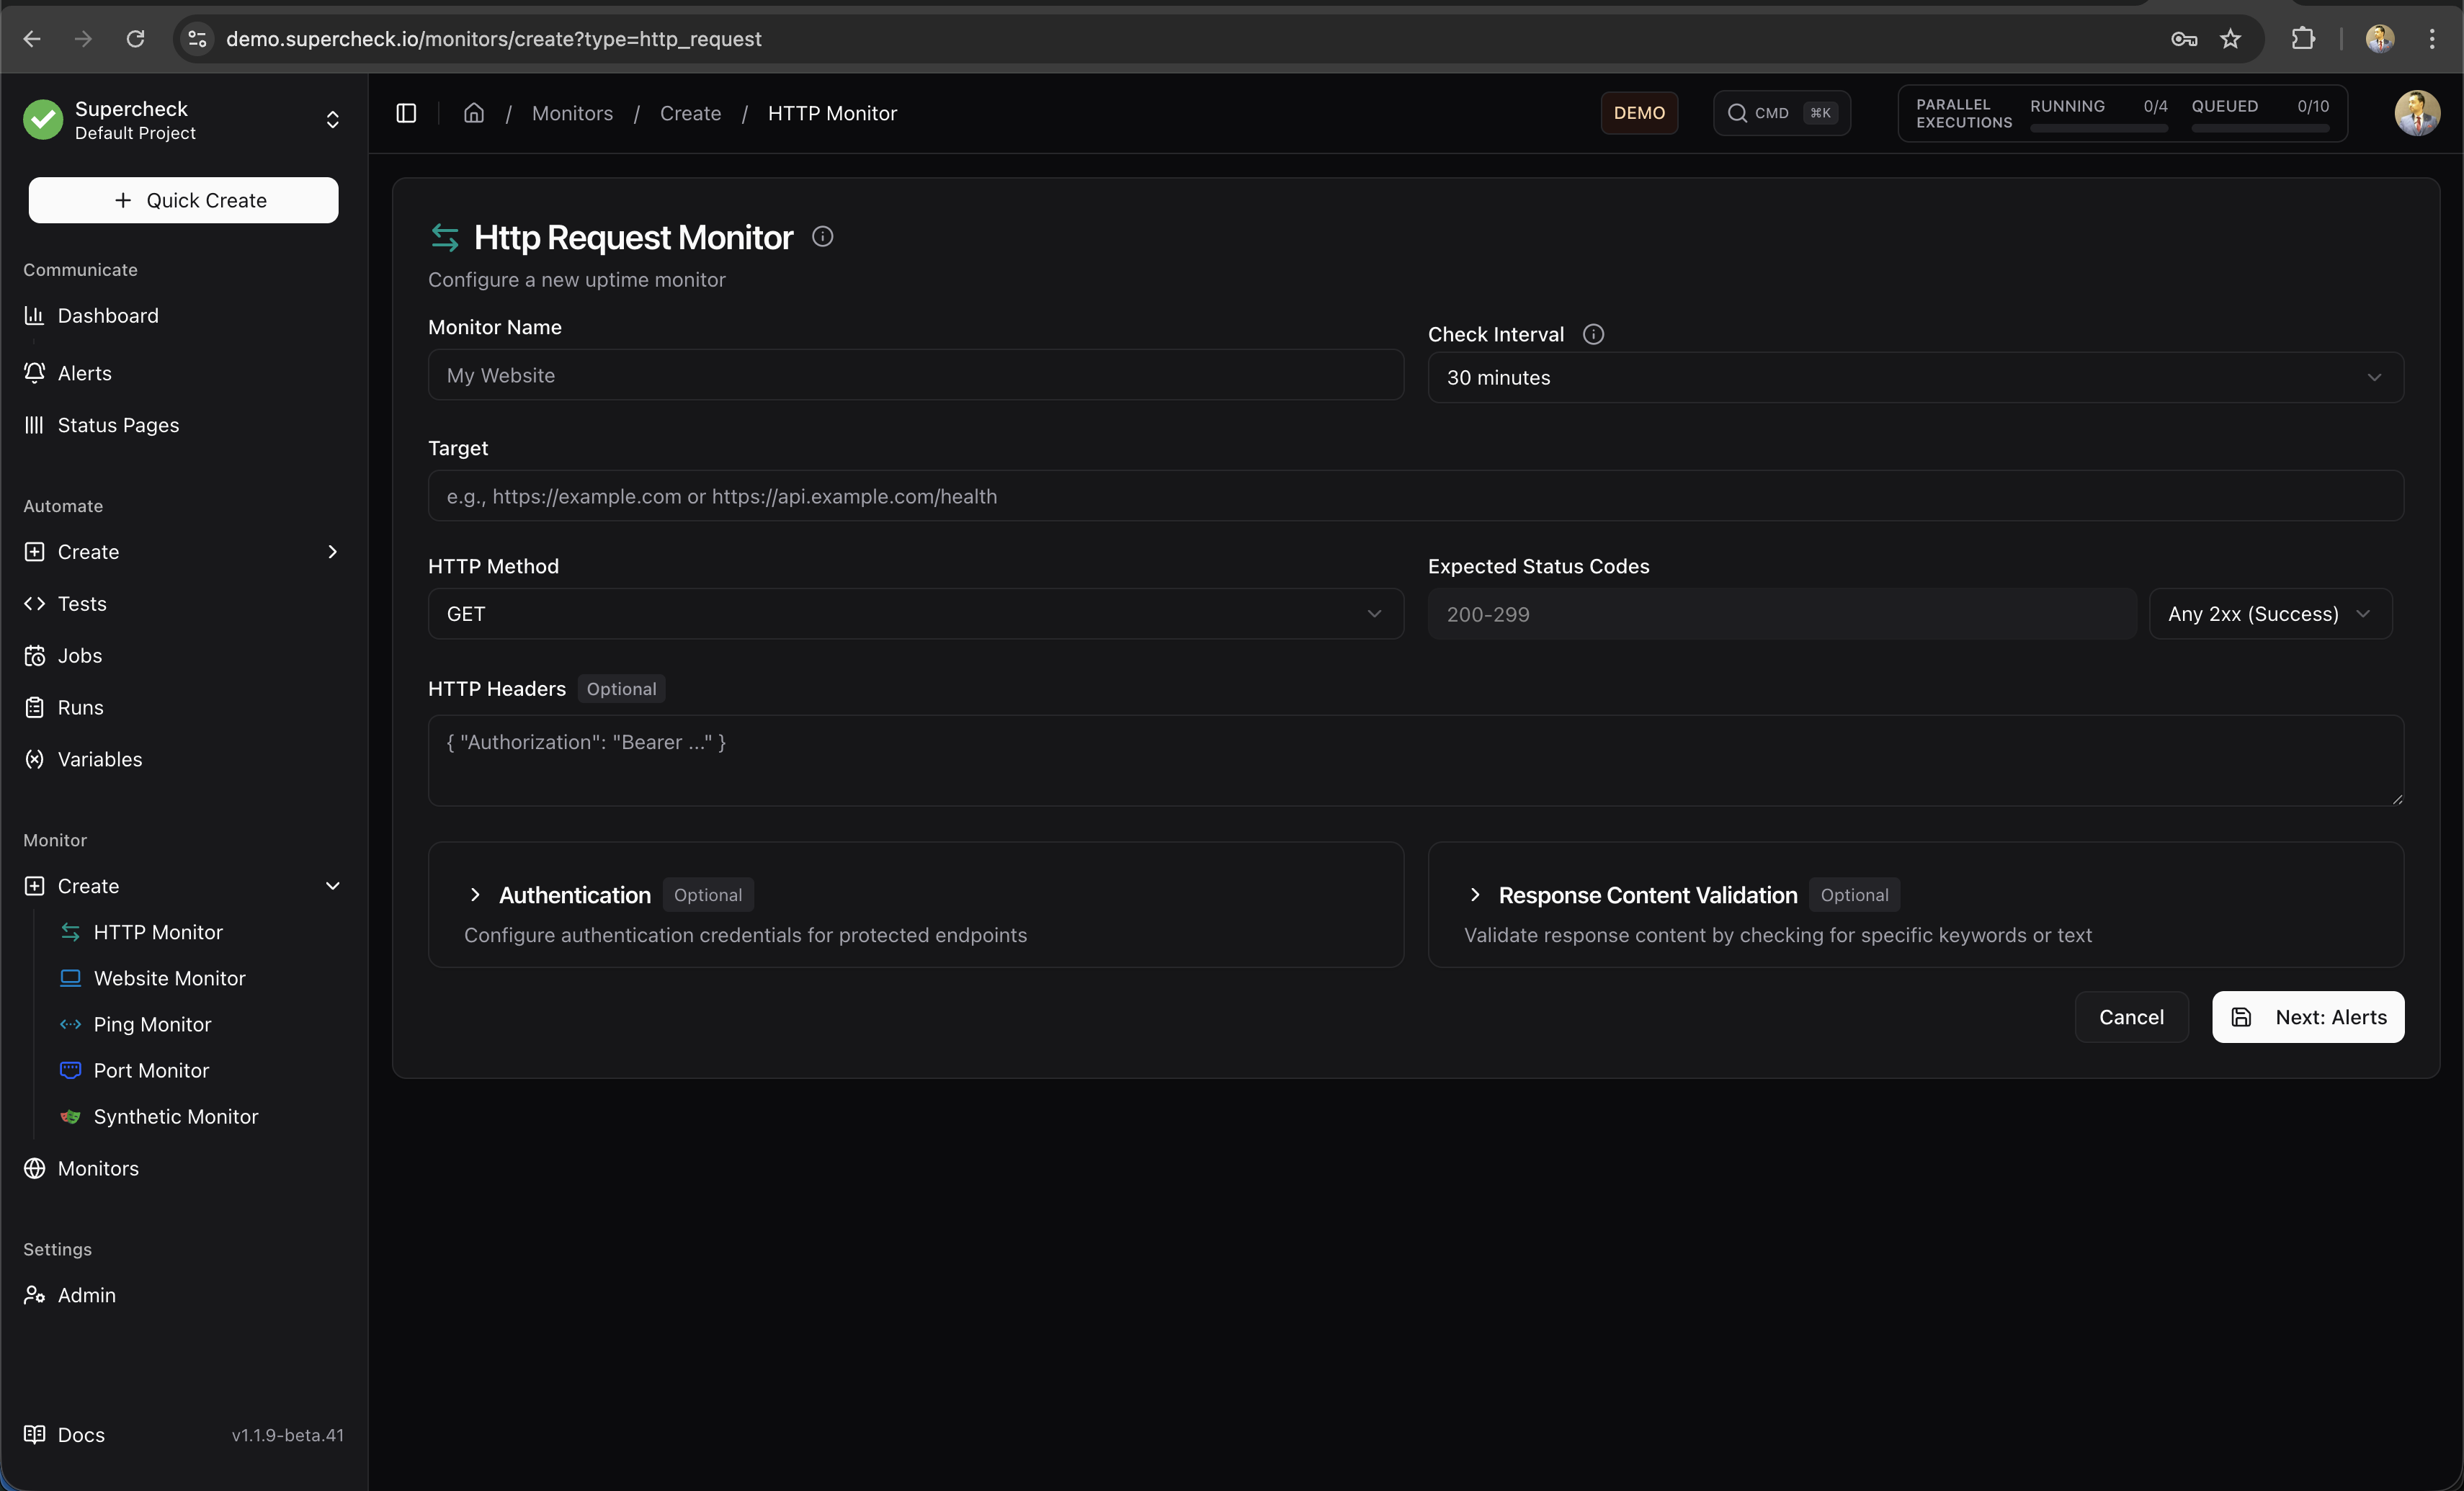
Ping Monitor
TCP reachability monitoring for hosts that do not expose an HTTP endpoint.
What it checks:
- Host is reachable over TCP on port 443 or 80
- Connection latency (response time)
Best for:
- Server availability
- Network infrastructure
- VPN endpoints
- Internal services
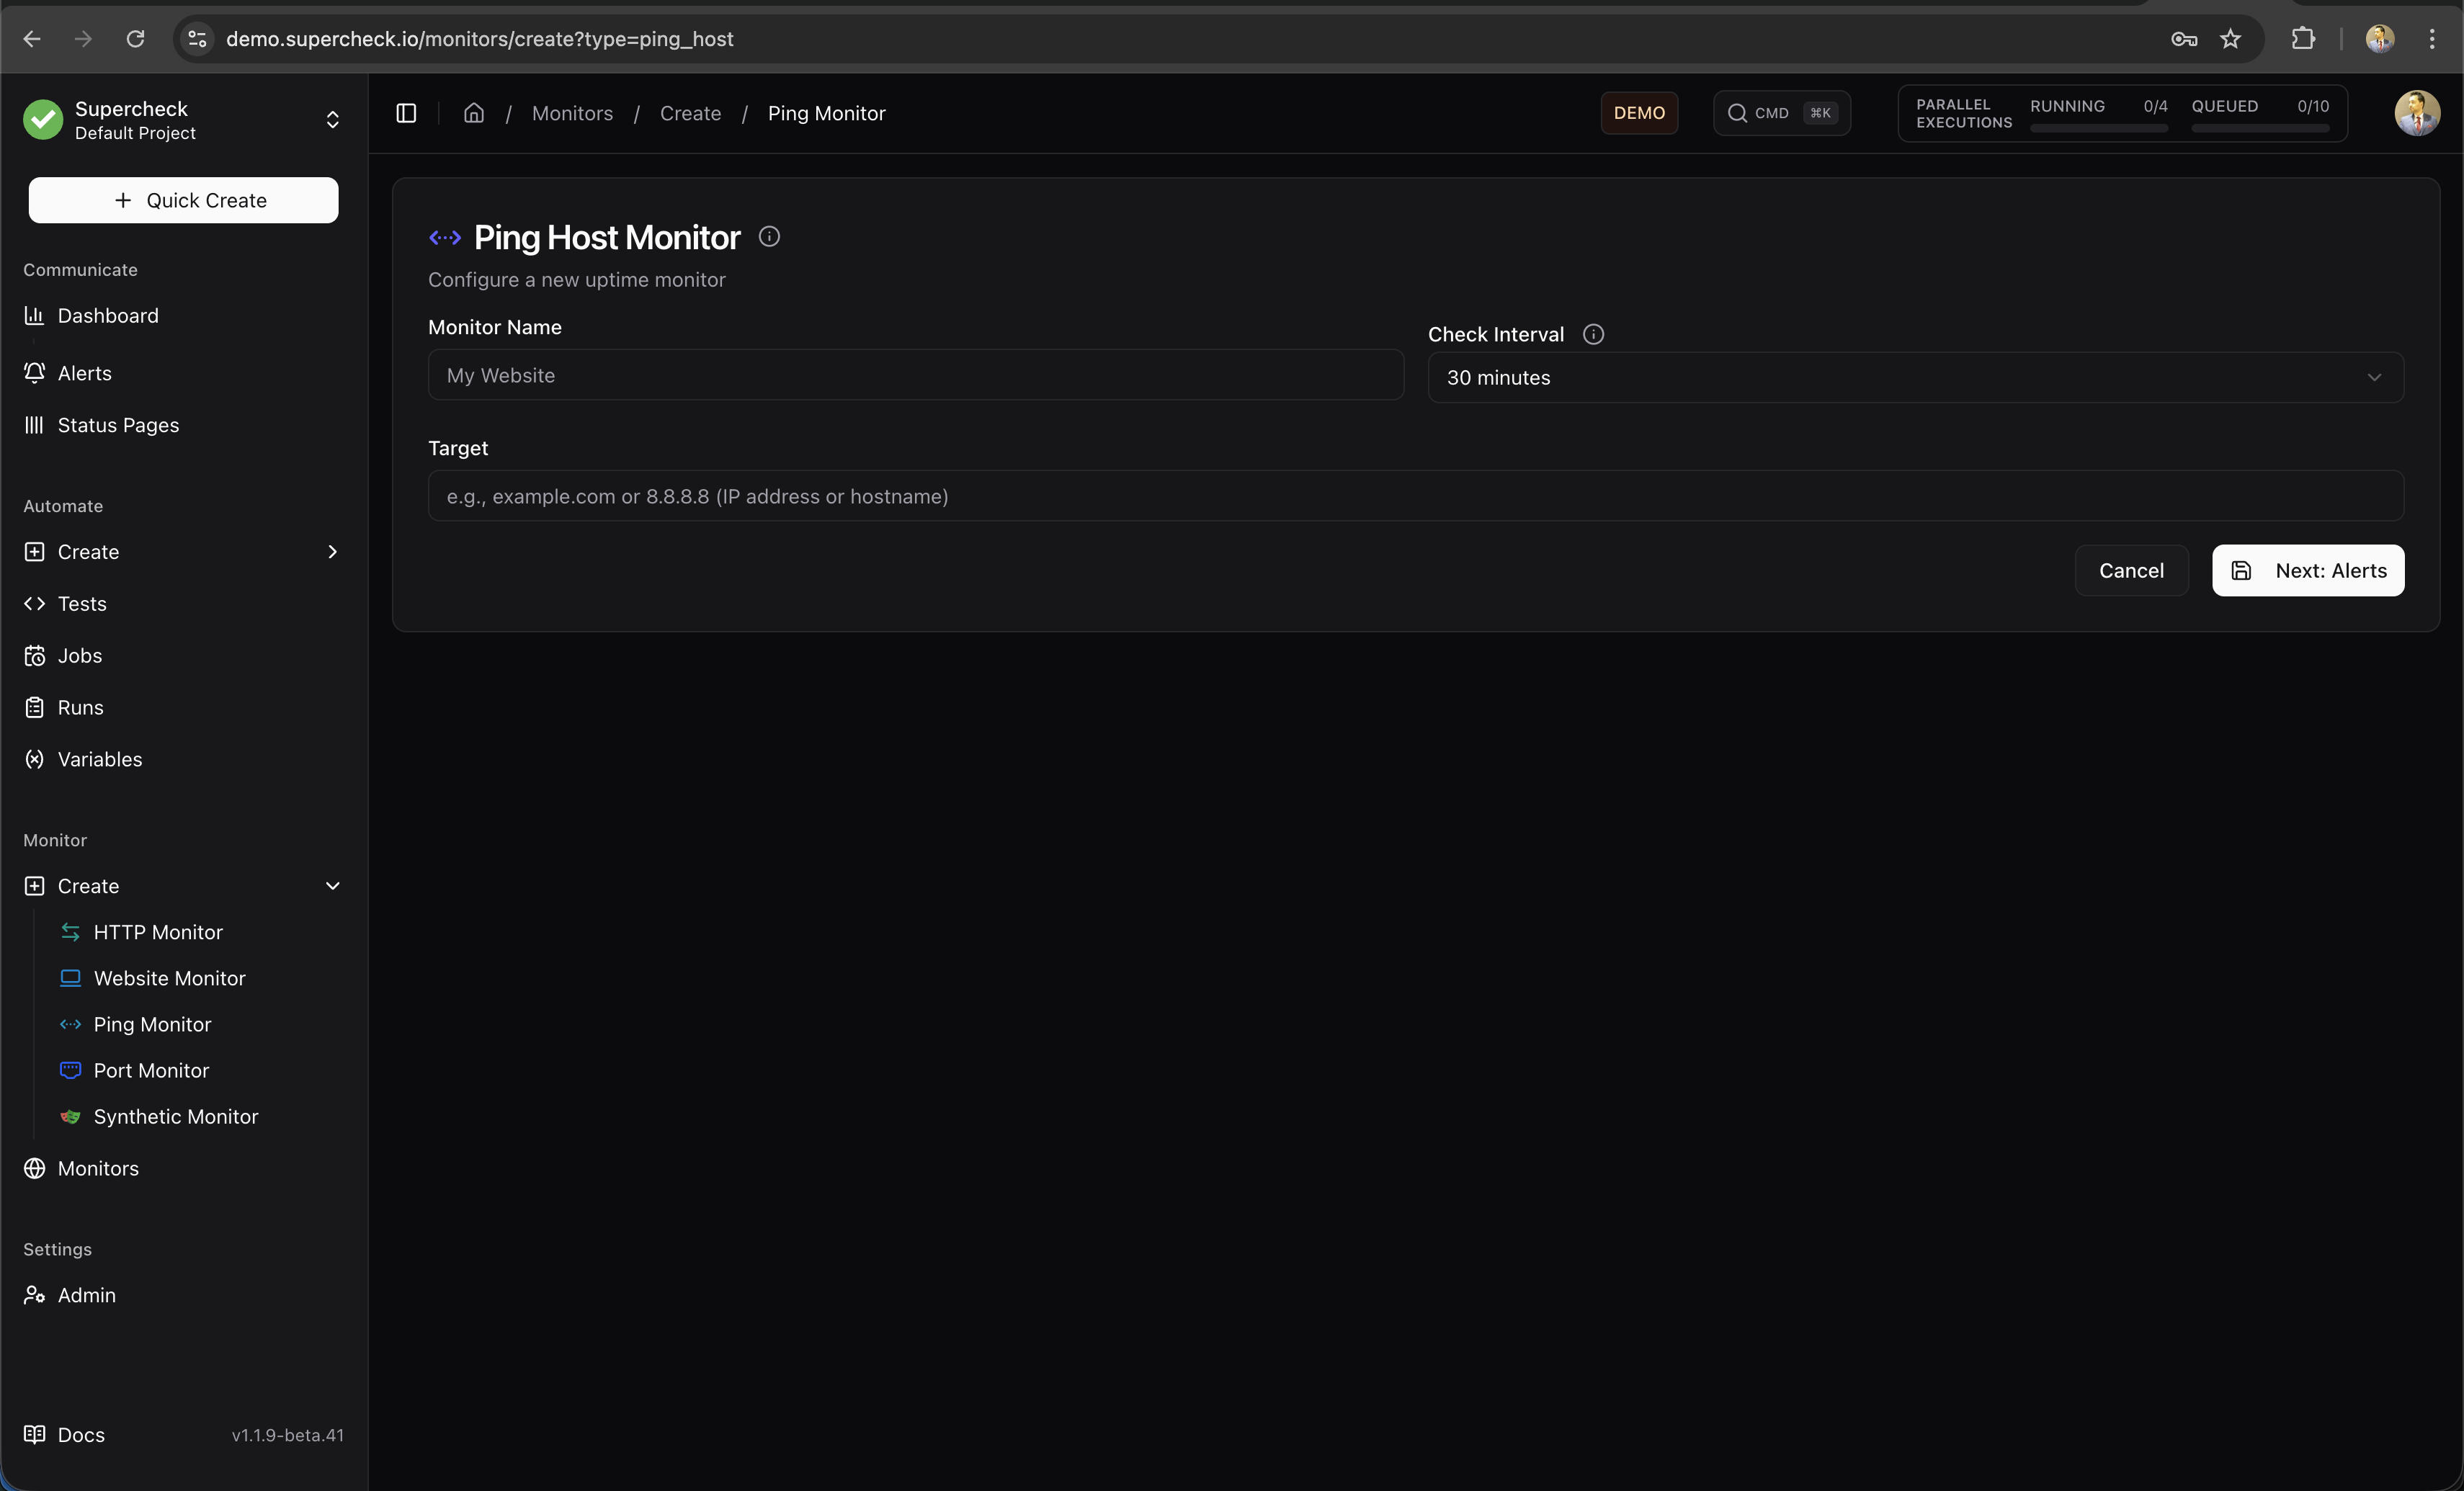
Ping monitors use TCP connectivity on ports 443 and 80 rather than ICMP. If the target host does not accept TCP connections on either port, the check fails.
Port Monitor
Verify that specific services are listening on expected ports.
What it checks:
- TCP or UDP port is open and accepting connections
- Connection can be established within timeout
- Service is responding on the specified port
Best for:
- Database servers (PostgreSQL 5432, MySQL 3306)
- Cache servers (Redis 6379, Memcached 11211)
- Mail servers (SMTP 25/587, IMAP 993)
- Custom services on non-standard ports
UDP checks send a packet; a passing result does not confirm that the application replied. Use TCP or an application-level check when you need response verification.
Synthetic Monitor
Run full Playwright browser tests on a schedule to validate complete user flows.
What it checks:
- Complete user journeys (login, checkout, form submission)
- JavaScript-rendered content
- Multi-step workflows
- Visual elements and interactions
Best for:
- Critical user flows (login, signup, checkout)
- Single-page applications (SPAs)
- Complex workflows requiring browser interaction
- End-to-end validation of user experience
Set up a synthetic monitor:
- Create a Playwright test in the Playground
- Save the test to your project
- Create a Synthetic Monitor and select your test
- Set the check interval (minimum 5 minutes)
- Monitor runs your test and reports pass/fail status
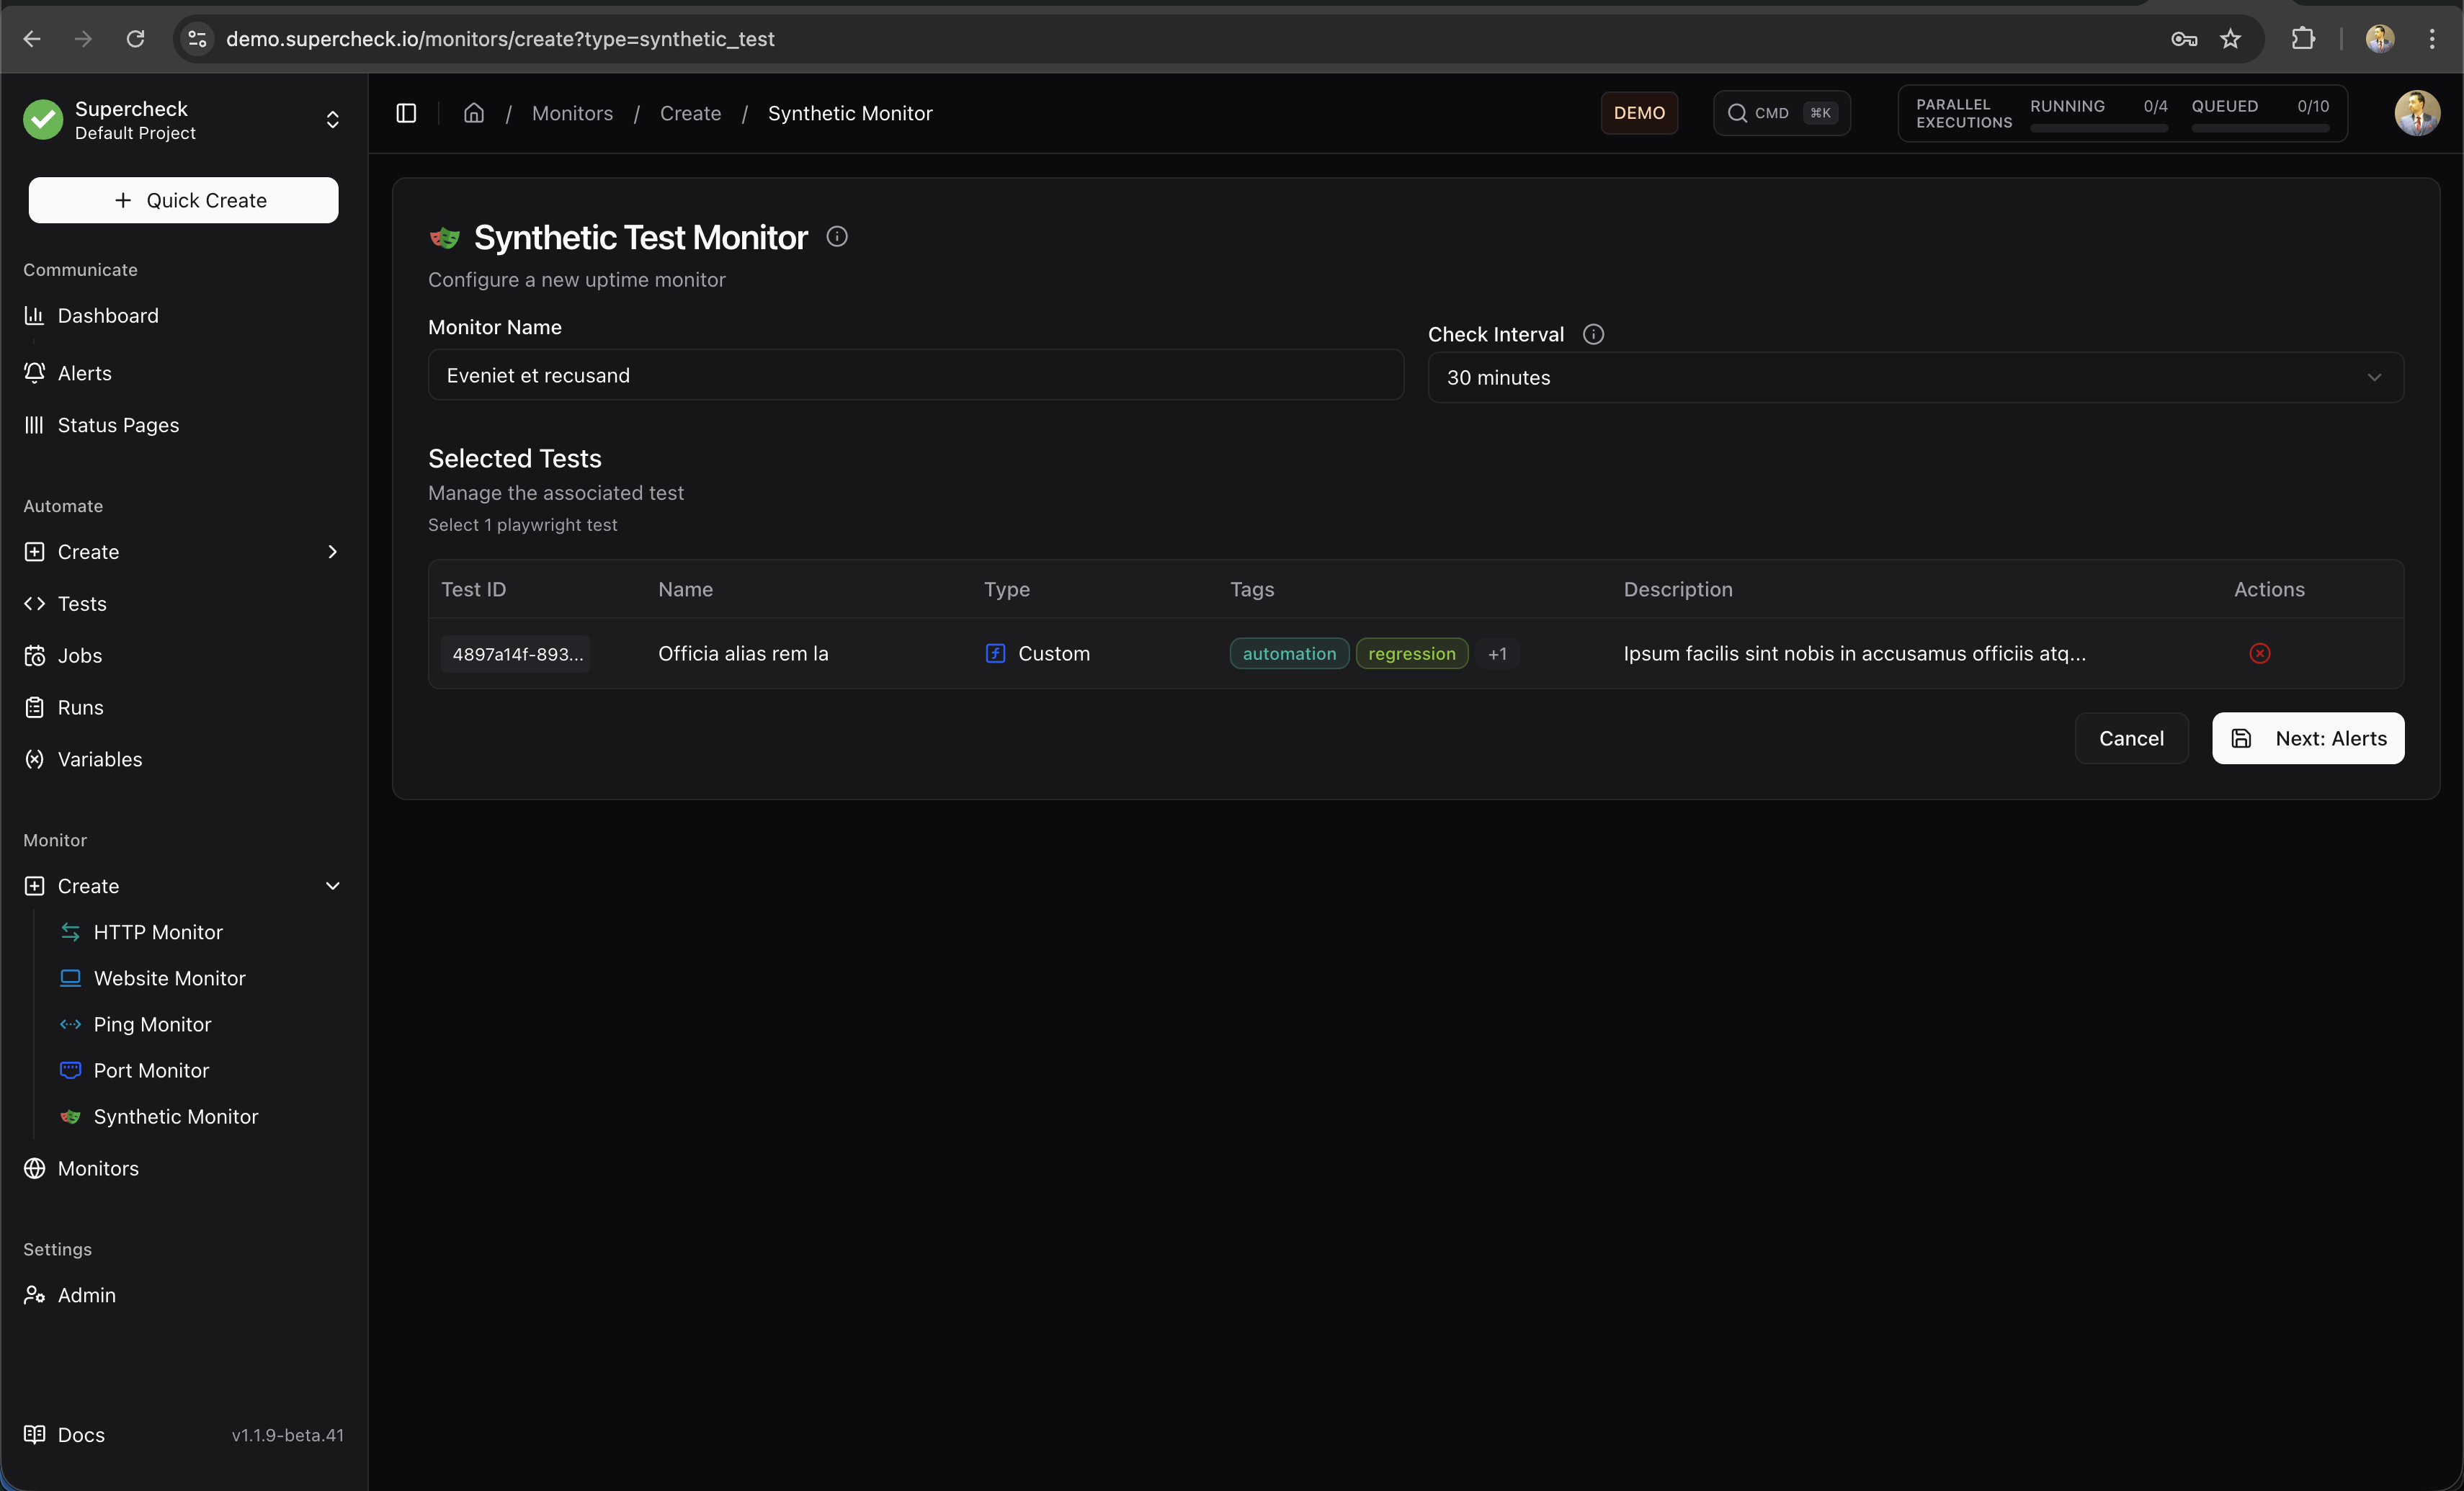
Set synthetic monitor intervals longer than your test execution time to prevent overlapping runs. For a test that takes 2 minutes, use a 5+ minute interval.
📚 Playwright Documentation — Learn more about writing browser tests
Multi-Location Monitoring
Run checks from multiple geographic locations to detect regional outages and measure latency from different parts of the world.
Dynamic Locations: Available locations are managed by your administrator through the Super Admin panel. Add new locations to enable multi-region monitoring from any geographic area.
Default Locations
| Region | Location | Notes |
|---|---|---|
| Local | Your server location | Default for self-hosted deployments |
Cloud deployments may include additional regions such as US East (Ashburn), EU Central (Nuremberg), and Asia Pacific (Singapore). Use the monitor's location picker to see which regions your project can use.
Choose Monitoring Locations
Select the regions you want to monitor, then use the location filter on the monitor detail page to compare results.
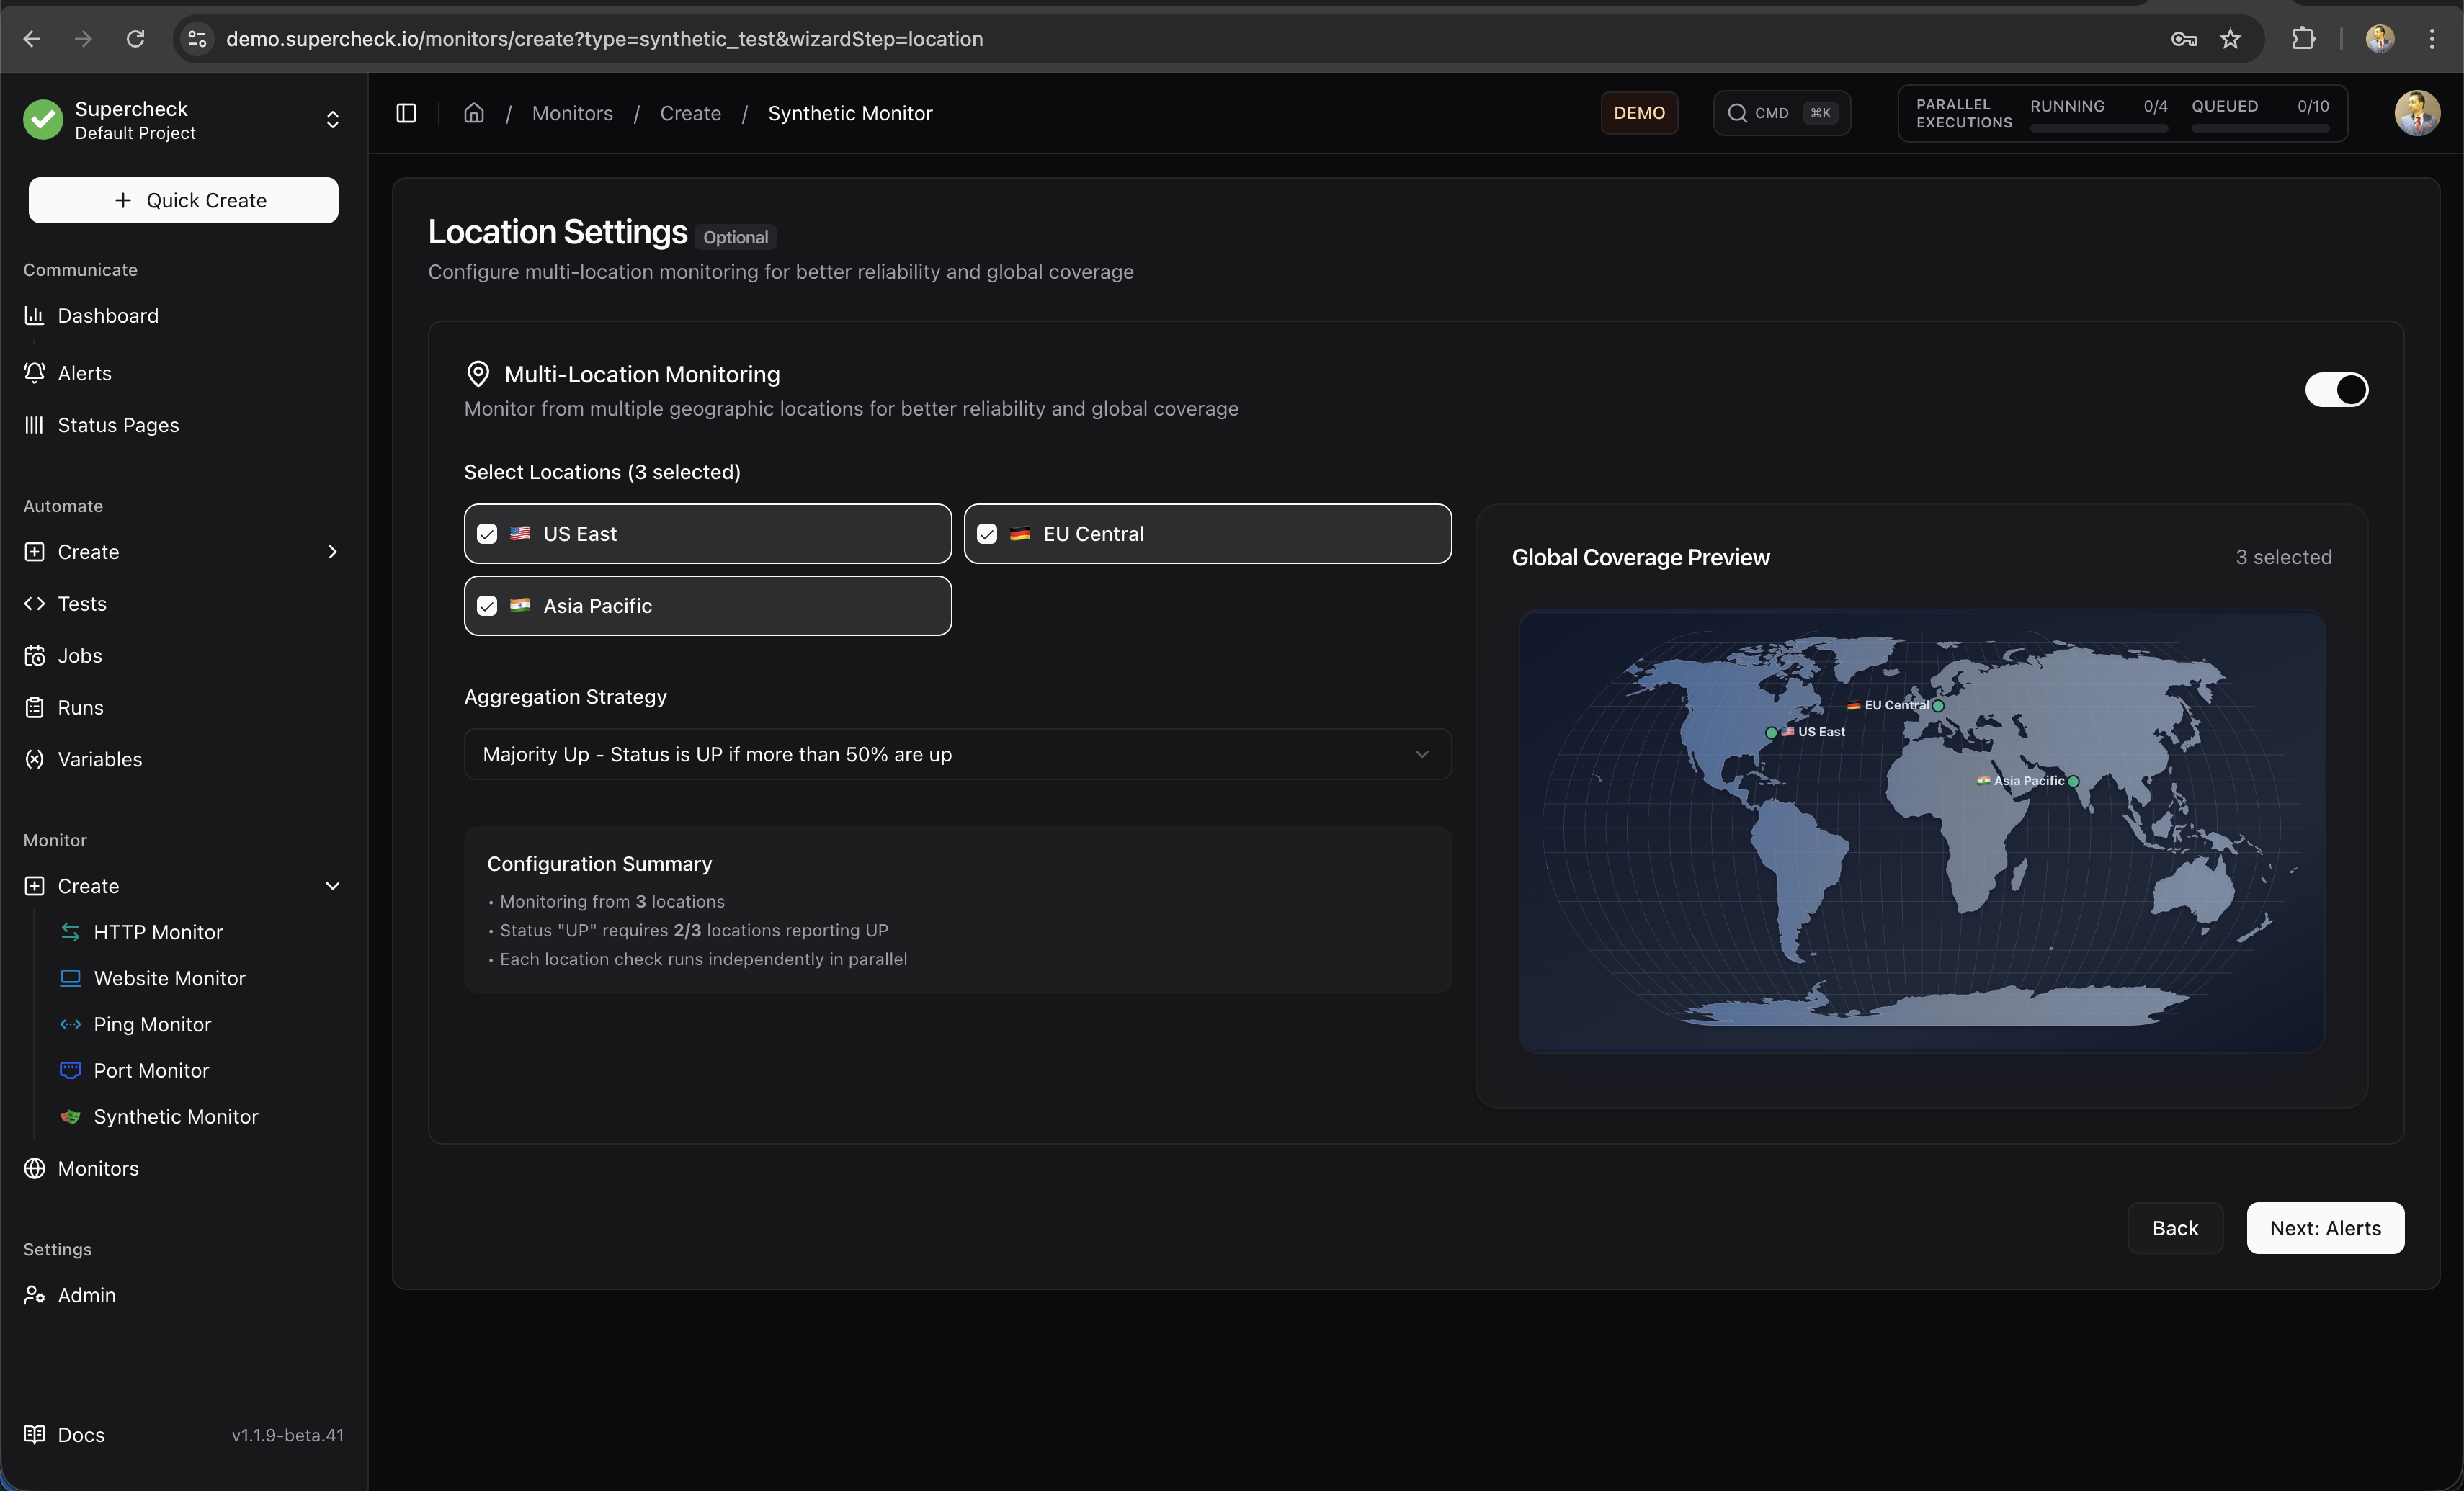
Single Location: When only one location is available, the multi-location configuration UI is automatically hidden. Location settings appear dynamically when additional locations are added via the Super Admin panel.
Supercheck enqueues checks to the online subset of enabled locations allowed by the project. Overall status still evaluates configured locations: missing results cannot satisfy All, and the majority is measured against configured locations. The multi-location alert threshold path is selected when more than one unique location is configured and enabled; an offline location does not switch a partial cycle to per-result thresholding. Missing configured locations count as failures, so a partial result is stored as Down. If worker-registry access fails, affected monitors remain Down until checks resume. Review per-location results to find a regional outage even when the overall status is Up.
Self-Hosted Deployments: By default, self-hosted instances have a single local location. All checks execute from your worker. For true geographic distribution, deploy additional workers in different regions and add the corresponding locations via the Super Admin panel.
Alert Configuration
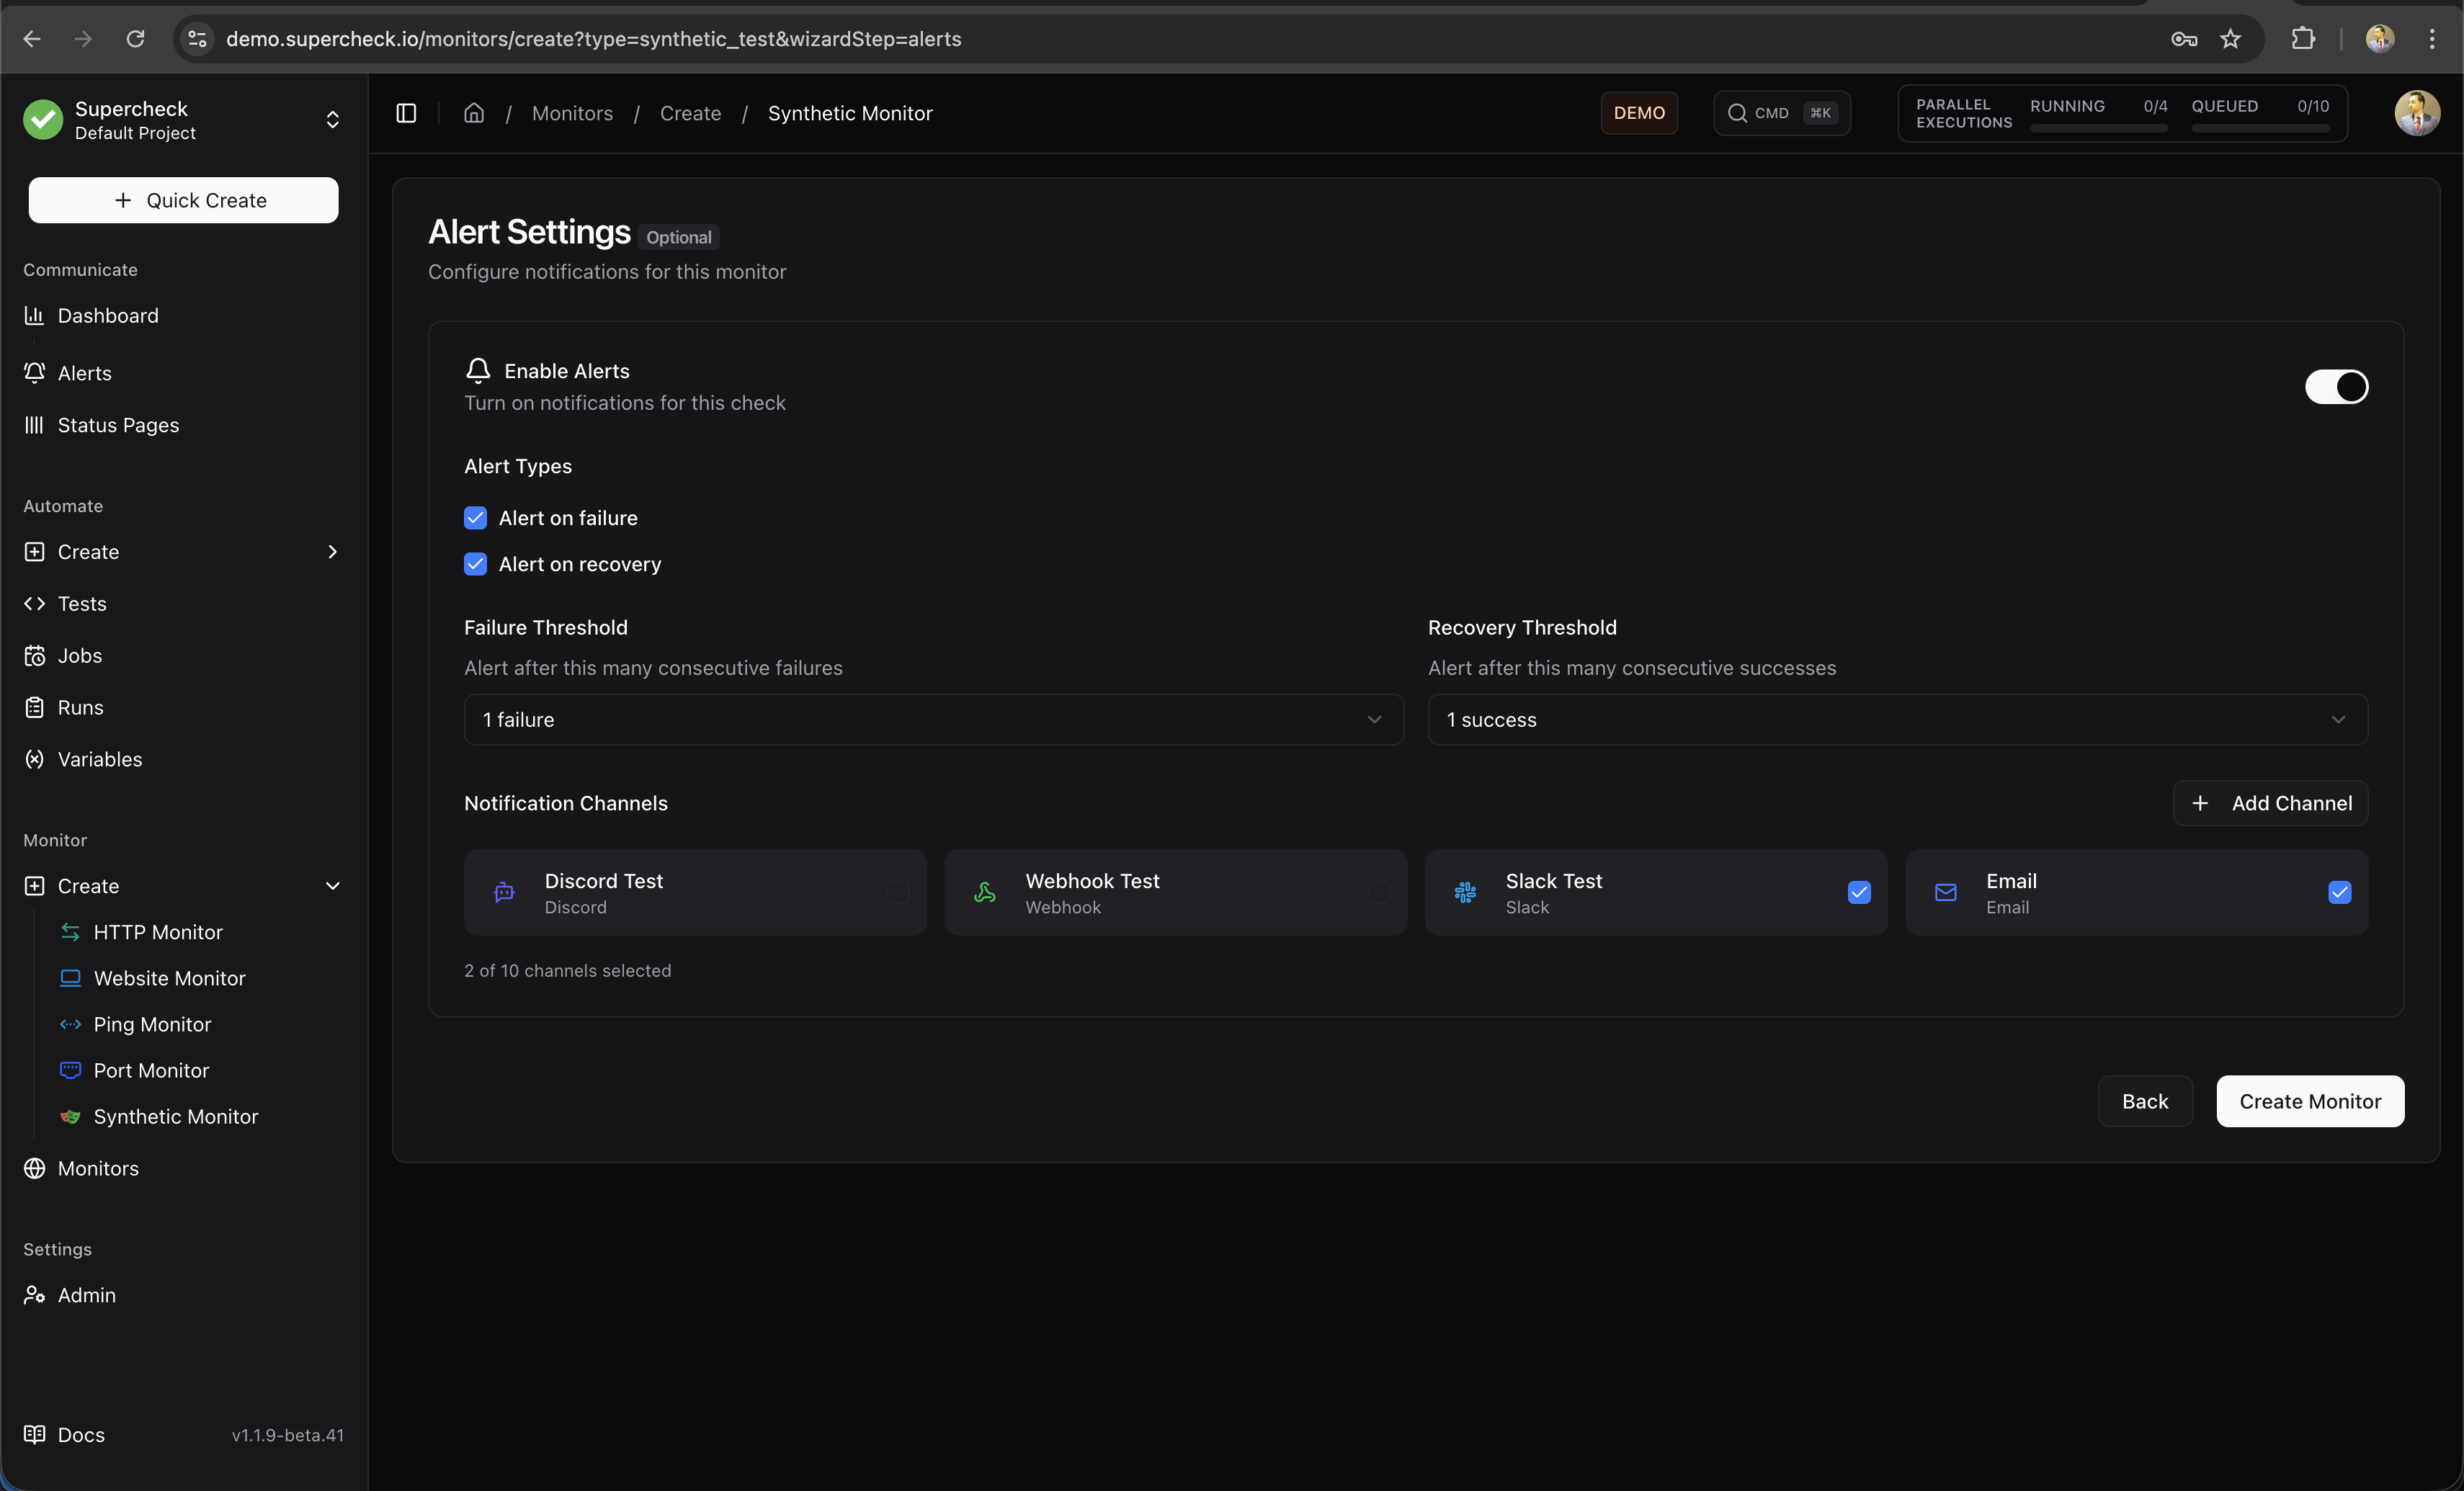
Configure when and how you receive notifications about monitor status changes.
Alert Settings
| Setting | Description | Recommended |
|---|---|---|
| Enable Alerts | Turn notifications on/off for this monitor | On for production services |
| Alert on Failure | Notify when monitor exceeds failure threshold | Always enable |
| Alert on Recovery | Notify when monitor returns to healthy state | Enable for critical services |
| Failure Threshold | Consecutive failures before alerting (1-5) | 2-3 to avoid false positives |
| Recovery Threshold | Consecutive successes before recovery alert (1-5) | 2 to confirm stability |
| Notification Channels | Which providers receive alerts | Multiple channels for critical services |
Threshold Logic
Thresholds prevent alert fatigue from transient issues:
Failure Threshold
The number of consecutive failures required before sending the first failure alert. This prevents alerts from single network blips.
Recovery Threshold
The number of consecutive successes required before sending a recovery alert. This ensures the service is truly stable before confirming recovery.
Alert Limiting
- Maximum 3 alerts per failure or recovery sequence
- Counter resets when status changes
Configuration: Failure Threshold = 3, Recovery Threshold = 2
| Check | Result | Consecutive Count | Alert Sent |
|---|---|---|---|
| 1 | ❌ Fail | 1 failure | — |
| 2 | ❌ Fail | 2 failures | — |
| 3 | ❌ Fail | 3 failures ✓ | Failure Alert |
| 4 | ❌ Fail | 4 failures | — |
| 5 | ✅ Pass | 1 success | — |
| 6 | ✅ Pass | 2 successes ✓ | Recovery Alert |
A threshold of 2-3 works well for most services. Use 1 only for extremely critical services where any failure requires immediate attention.
Monitor Details Page
The monitor details page provides comprehensive visibility into your monitor's health, performance, and history.
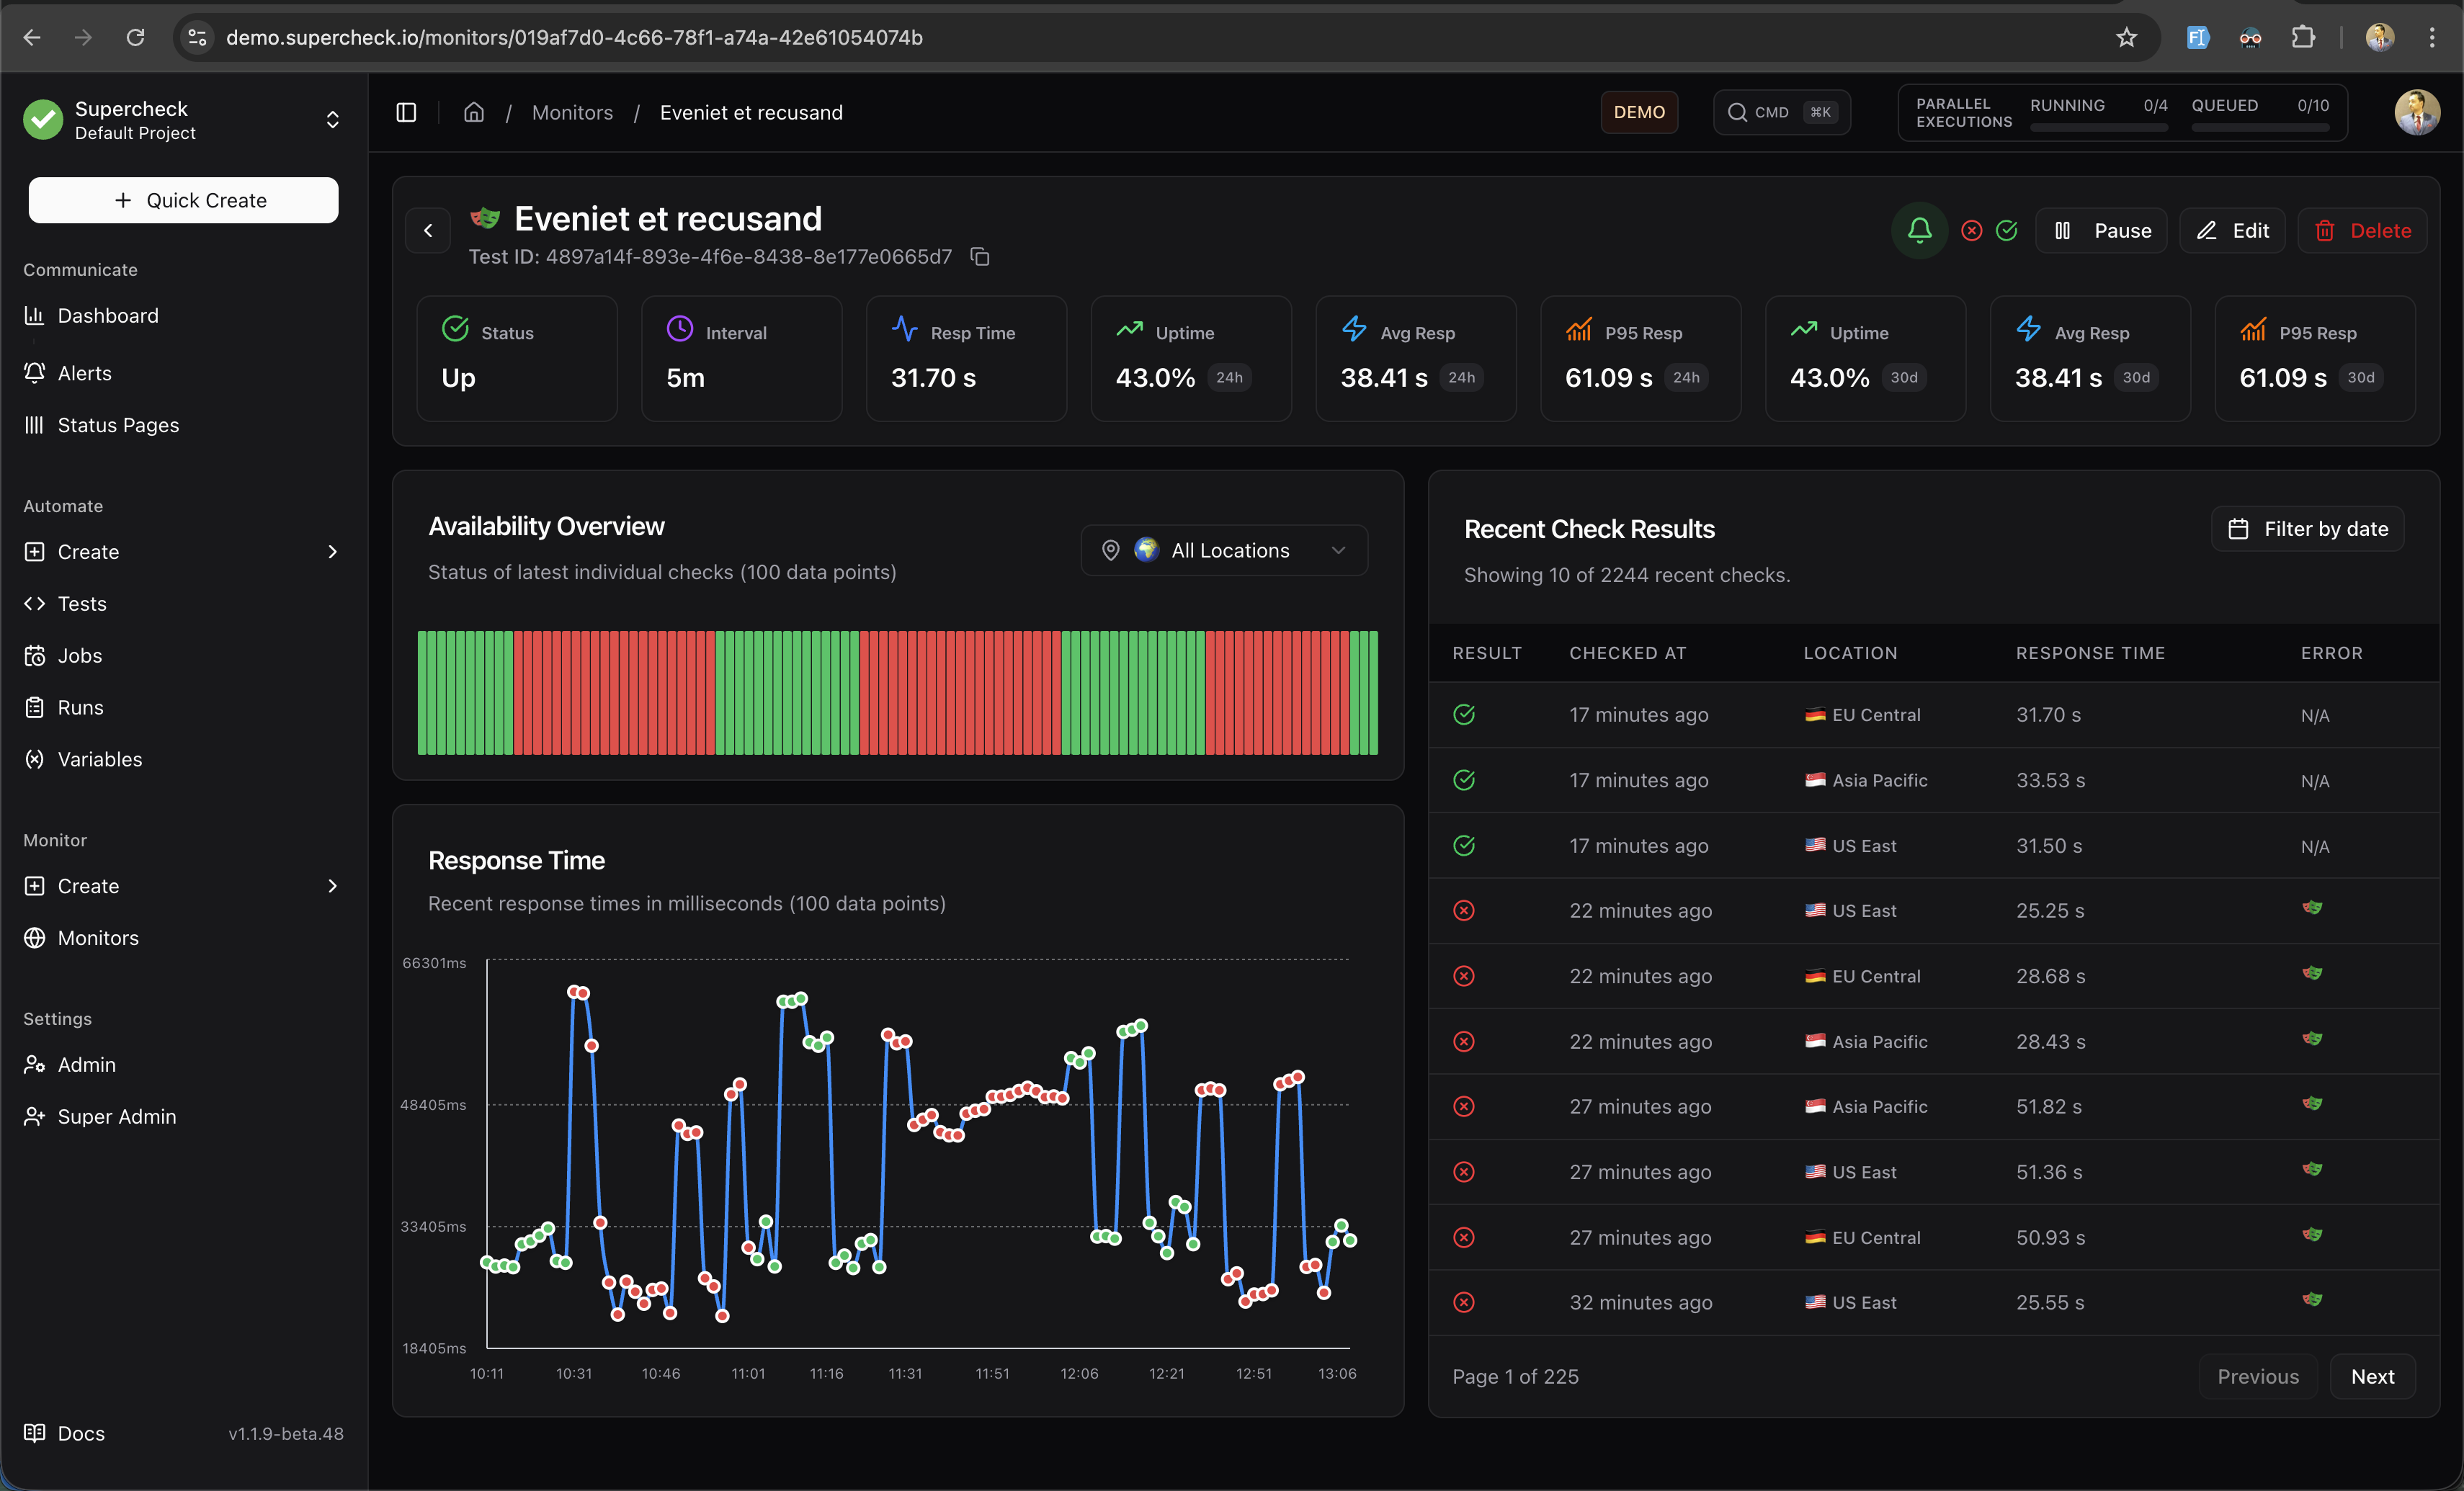
Header Section
The header displays essential monitor information at a glance:
- Monitor Name — The name you assigned to the monitor
- Test ID — For synthetic monitors, shows the linked Playwright test ID (click to copy)
- Action Buttons — Quick access to Pause, Edit, Delete, and AI Analyze operations
AI Analyze
Click AI Analyze in the header to generate an AI-powered analysis report for your monitor.
What AI Analyze Provides:
- Health Assessment — Clear status summary based on actual metrics
- Performance Analysis — Response time trends using your monitor's exact data
- Issue Diagnosis — Suggested causes with available error messages and timestamps
- Recommendations — Actionable next steps based on observed issues (only when problems exist)
For self-hosted deployments, an administrator must configure an AI provider to enable AI Analyze.
Key Metrics Bar
Nine key metrics are displayed prominently below the header:
| Metric | Description |
|---|---|
| Status | Current monitor status (Up, Down, Paused, Pending, Maintenance, Error) |
| Interval | How frequently checks run (e.g., 5m, 15m) |
| Resp Time | Latest response time from the most recent check |
| Uptime (24h) | Percentage of successful checks in the last 24 hours |
| Avg Resp (24h) | Average response time over the last 24 hours |
| P95 Resp (24h) | 95th percentile response time over the last 24 hours |
| Uptime (30d) | Percentage of successful checks in the last 30 days |
| Avg Resp (30d) | Average response time over the last 30 days |
| P95 Resp (30d) | 95th percentile response time (30d) — long-term performance indicator |
P95 Response Time represents the response time that 95% of your checks complete within. This metric helps identify tail latency issues that averages might hide.
Availability Overview
A visual bar chart showing the status of the last 100 individual checks:
- Green bars — Successful checks (monitor was up)
- Red bars — Failed checks (monitor was down)
- Location Filter — Filter by specific region or view all locations combined
This visualization helps you quickly identify patterns like intermittent failures or sustained outages.
Response Time Chart
An interactive line chart displaying response times over time:
- 100 Data Points — Shows the most recent 100 check results
- Multi-Location Data — Region is shown in the hover details
- Hover Details — View exact response time and timestamp on hover
- Visual Patterns — Identify latency spikes, trends, and anomalies
The chart helps you spot performance degradation before it impacts users.
Recent Check Results Table
A paginated table showing detailed results for each check:
| Column | Description |
|---|---|
| Result | Pass (✓) or Fail (✗) indicator |
| Checked At | When the check was performed (relative time) |
| Location | Which region performed the check (with flag icon) |
| Response Time | How long the check took |
| Error | For failed checks, shows the error message or links to report |
Features:
- Pagination — Navigate through historical results (10 per page)
- Date Filter — Filter results by specific date
- Location Filter — View results from a specific region only
Monitor Reports
For Synthetic Monitors, detailed reports are generated when checks fail. Access reports by clicking the report icon in the Error column of the Recent Check Results table.
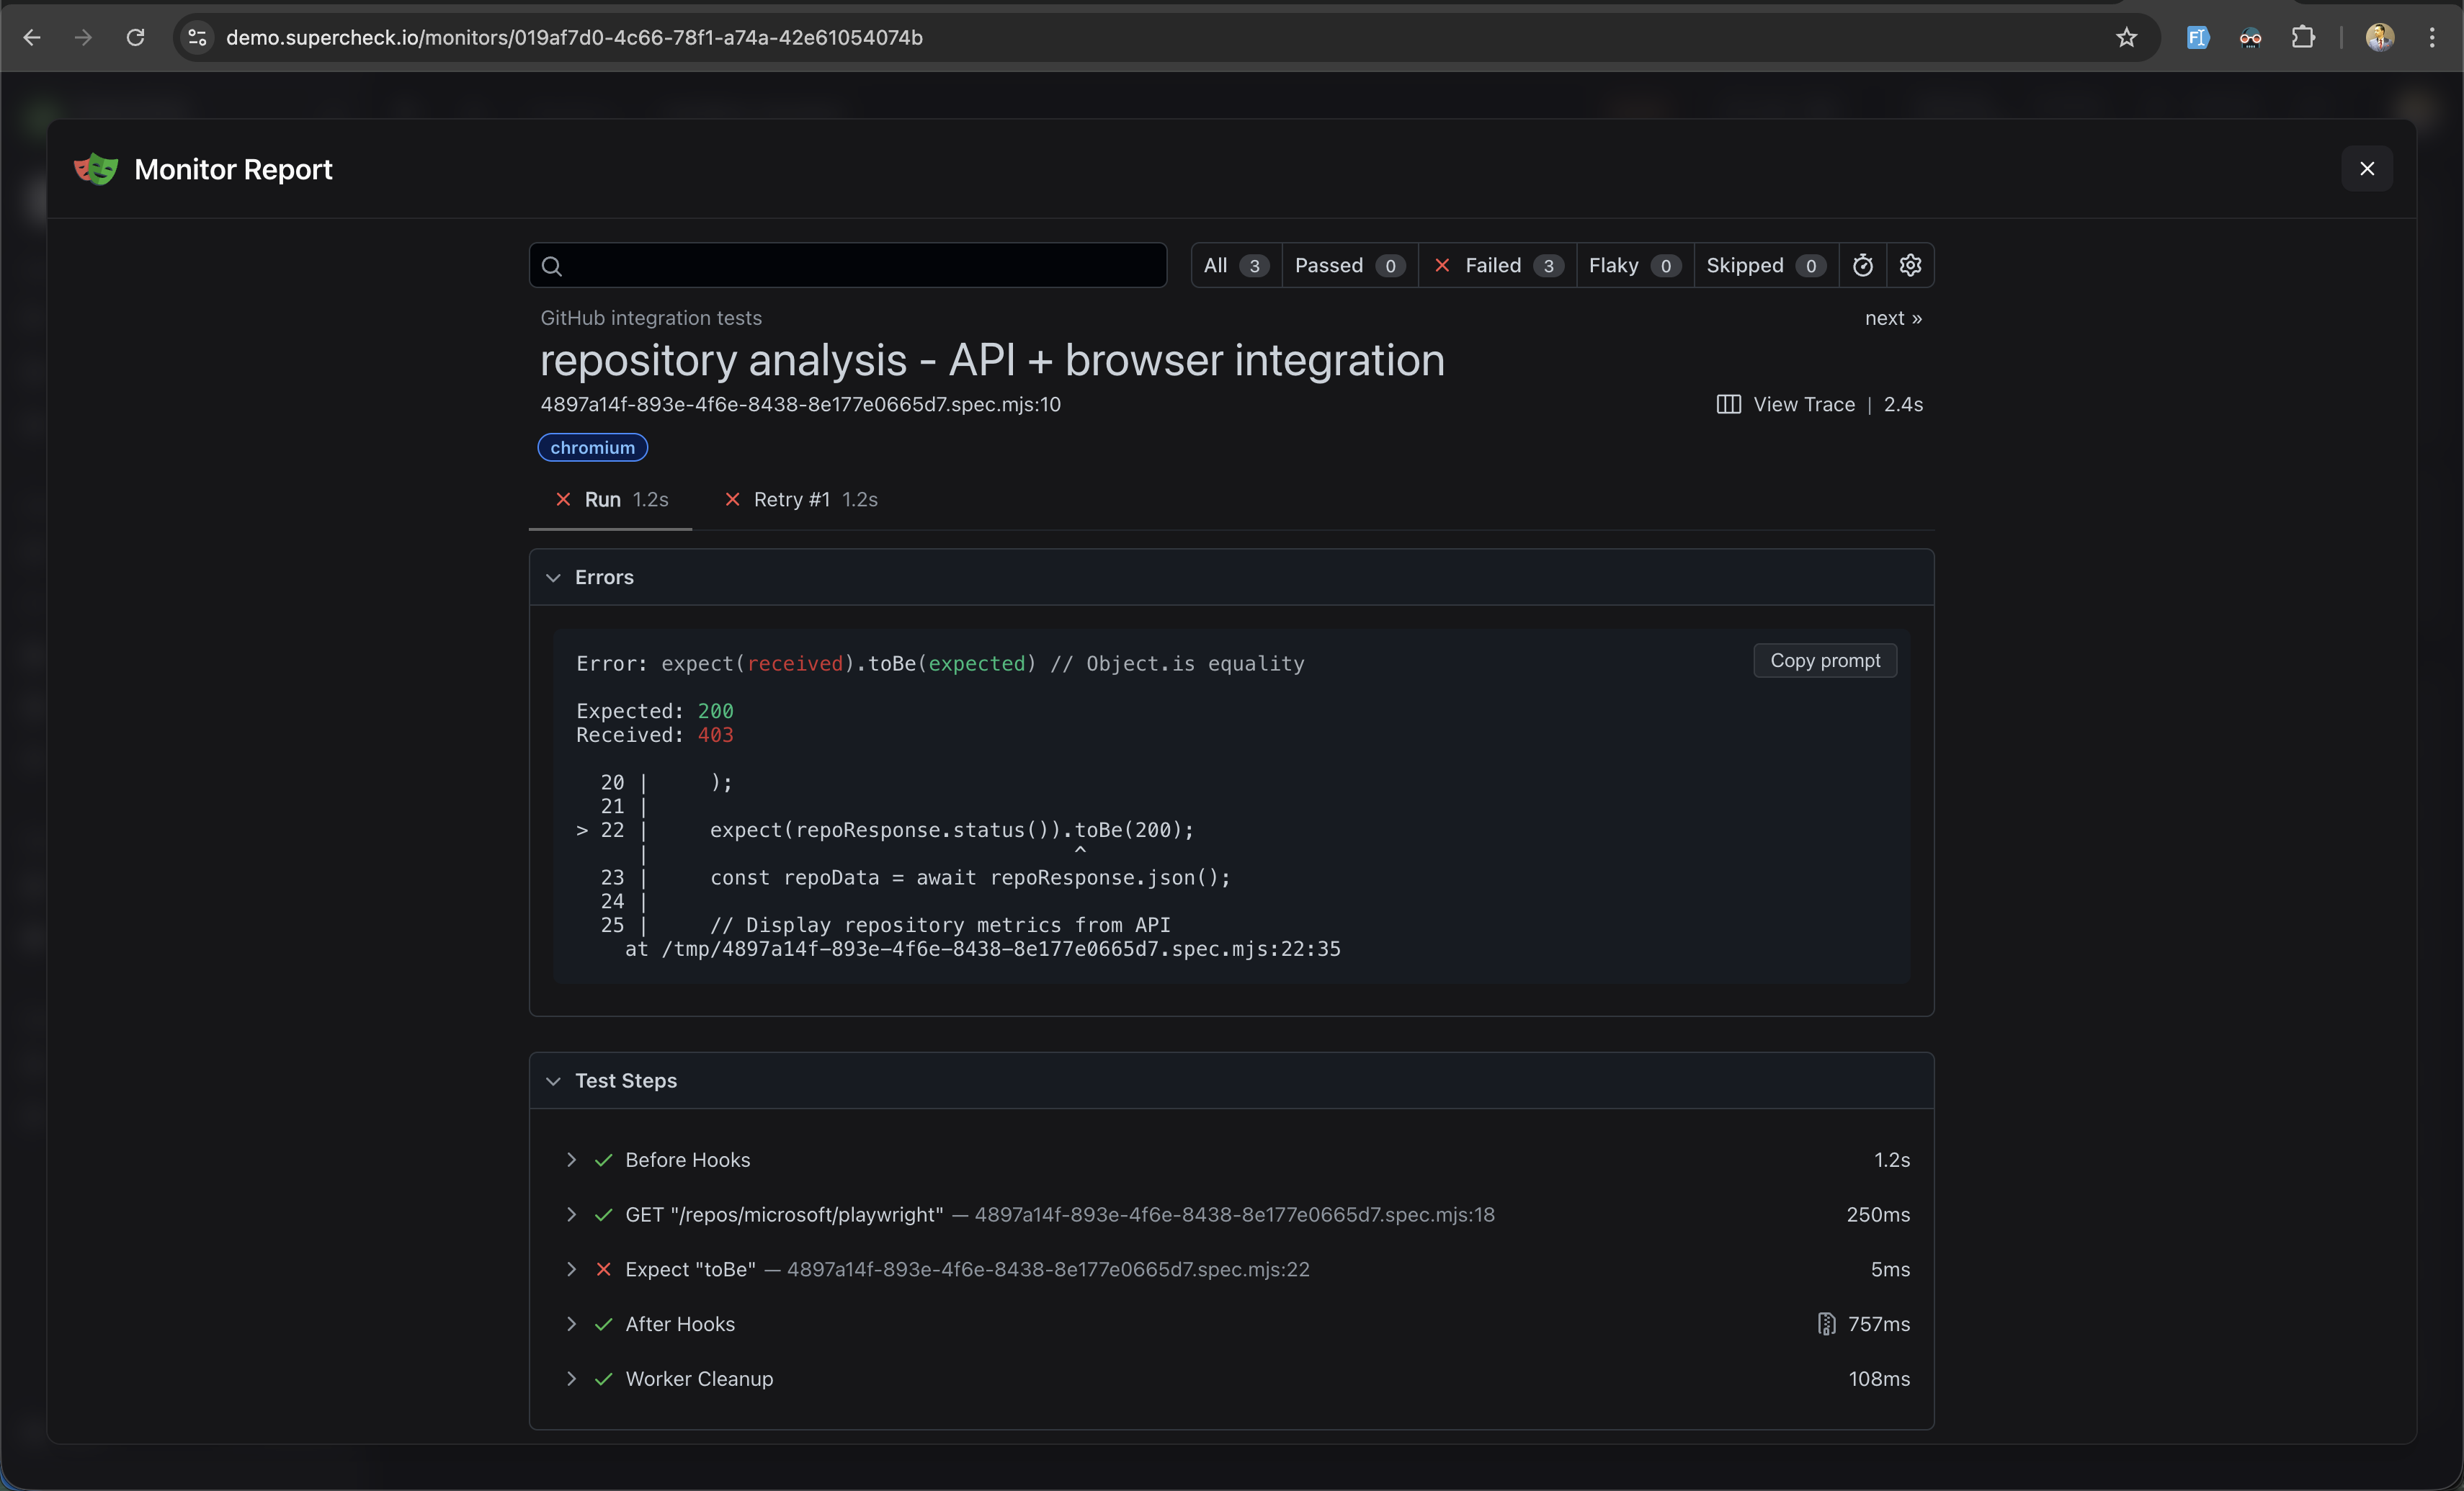
Report Contents
| Section | Description |
|---|---|
| Test Summary | Test name, file path, browser used, and execution duration |
| Error Details | Assertion failures with expected vs received values and stack trace |
| Test Steps | Timeline of all actions with pass/fail status and timing |
| View Trace | Opens trace viewer with video recording, screenshots, and network logs |
Use Copy Prompt to copy error details for AI-assisted debugging.
Monitor Status
| Status | Meaning | Action |
|---|---|---|
| Up | All checks passing | No action needed |
| Down | Latest aggregated check failed | Review results; notifications follow your alert thresholds |
| Paused | Monitoring disabled | Re-enable when ready |
| Pending | Initial check in progress | Wait for first result |
| Maintenance | Under maintenance | Monitor temporarily disabled |
| Error | Configuration or system error | Fix monitor configuration |
Check Intervals
| Interval | Best For | Notes |
|---|---|---|
| 1 minute | Critical production APIs | Fastest detection, highest resource usage |
| 5 minutes | Standard production services | Good balance of speed and efficiency |
| 15 minutes | Less critical services | Reduced resource usage |
| 30-60 minutes | Low-priority or development | Minimal resource usage |
Synthetic Monitors: Minimum interval is 5 minutes to prevent overlapping Playwright executions. Set intervals longer than your test execution time—for a 2-minute test, use 5+ minute intervals.